1 - Deployment Performance & Health 185,459185,459
Description
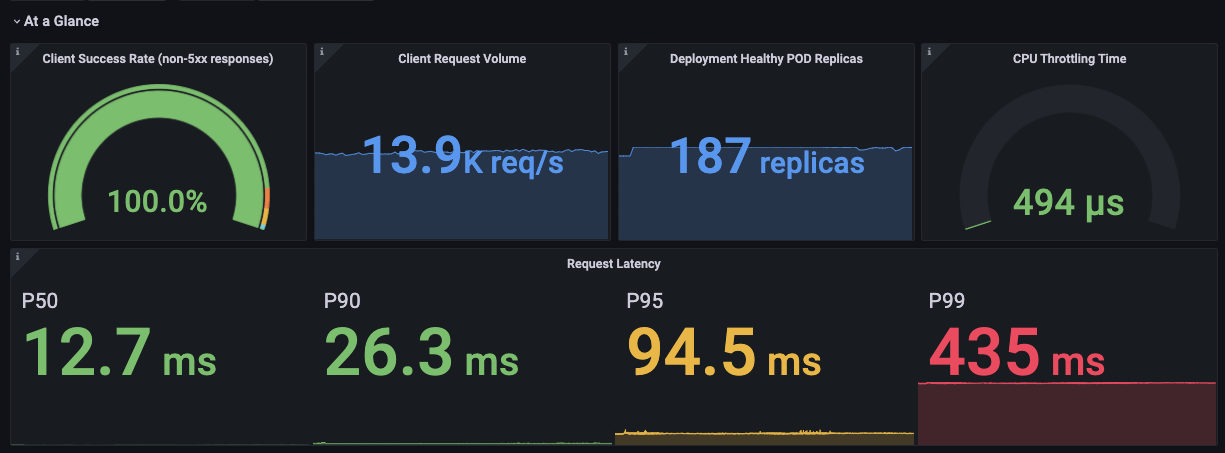
This dashboard monitors deployed application health and performance end-to-end, combining request-level observability with pod and node resource metrics. It highlights latency distributions, success vs error rates, and resource saturation, enabling rapid diagnosis of performance regressions and capacity constraints. Key metrics include istio_request_duration_milliseconds_bucket for latency across response codes, istio_requests_total with % of Responses By Response Code to track success and error mix, and container_cpu_cfs_throttled_seconds_total alongside memory and pod replica data to surface CPU throttling and resource pressure.
Screenshots
Used Metrics 2424
-
container_cpu_cfs_throttled_seconds_total
-
container_cpu_usage_seconds_total
-
container_fs_reads_bytes_total
-
container_fs_reads_total
-
container_fs_writes_bytes_total
-
container_fs_writes_total
-
container_memory_working_set_bytes
-
container_network_receive_bytes_total
-
container_network_transmit_bytes_total
envoy_server_total_connections
istio_request_duration_milliseconds_bucket
istio_requests_total
kube_deployment_status_replicas_available
kube_deployment_status_replicas_unavailable
kube_horizontalpodautoscaler_spec_max_replicas
kube_horizontalpodautoscaler_spec_min_replicas
kube_horizontalpodautoscaler_spec_target_metric
kube_horizontalpodautoscaler_status_current_replicas
kube_horizontalpodautoscaler_status_desired_replicas
kube_pod_container_info
kube_pod_container_resource_limits
kube_pod_container_resource_requests
kube_pod_container_status_restarts_total
-
node_vmstat_oom_kill