1 OpenEBS Dashboard 414,931414,931 4.0 (2 reviews)
Description
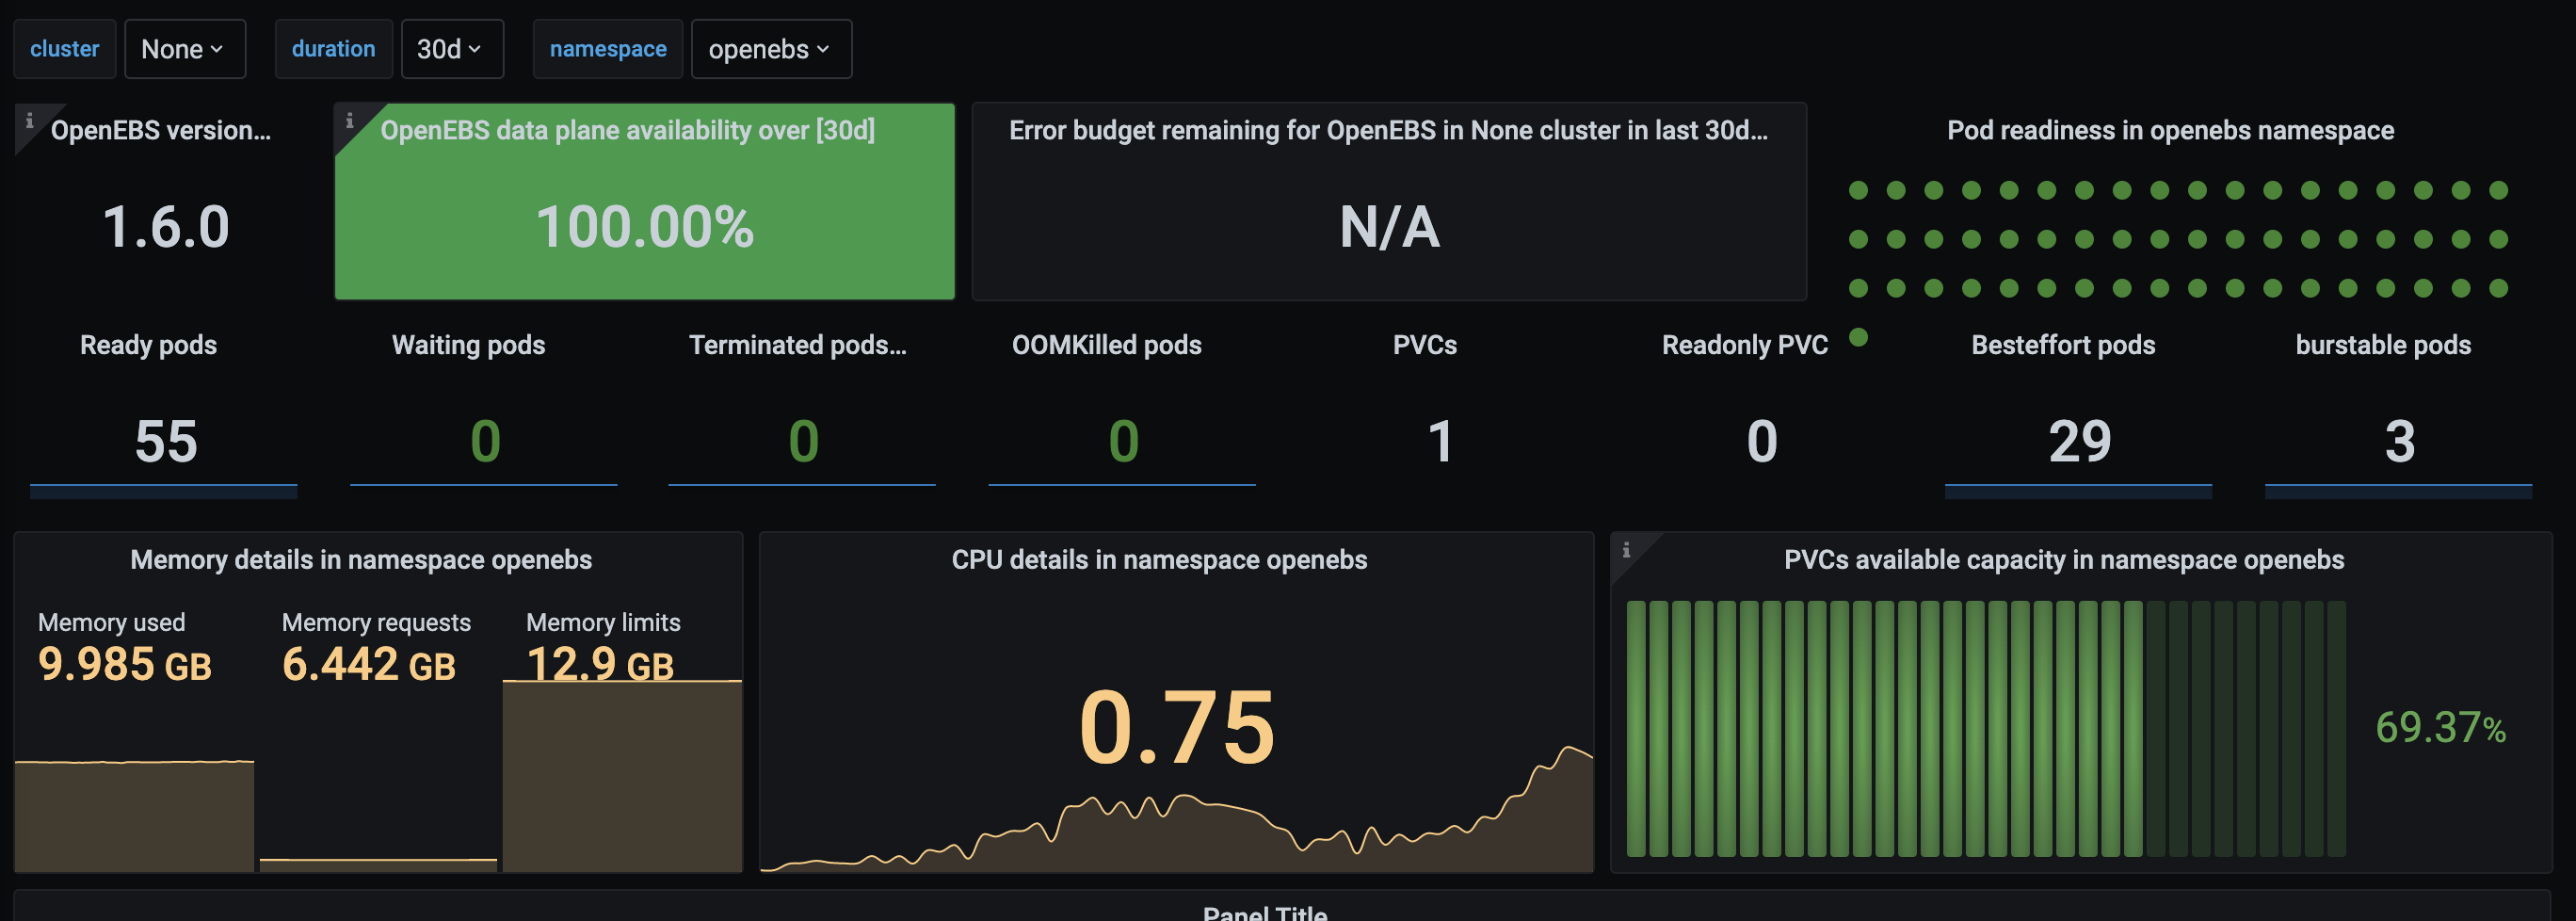
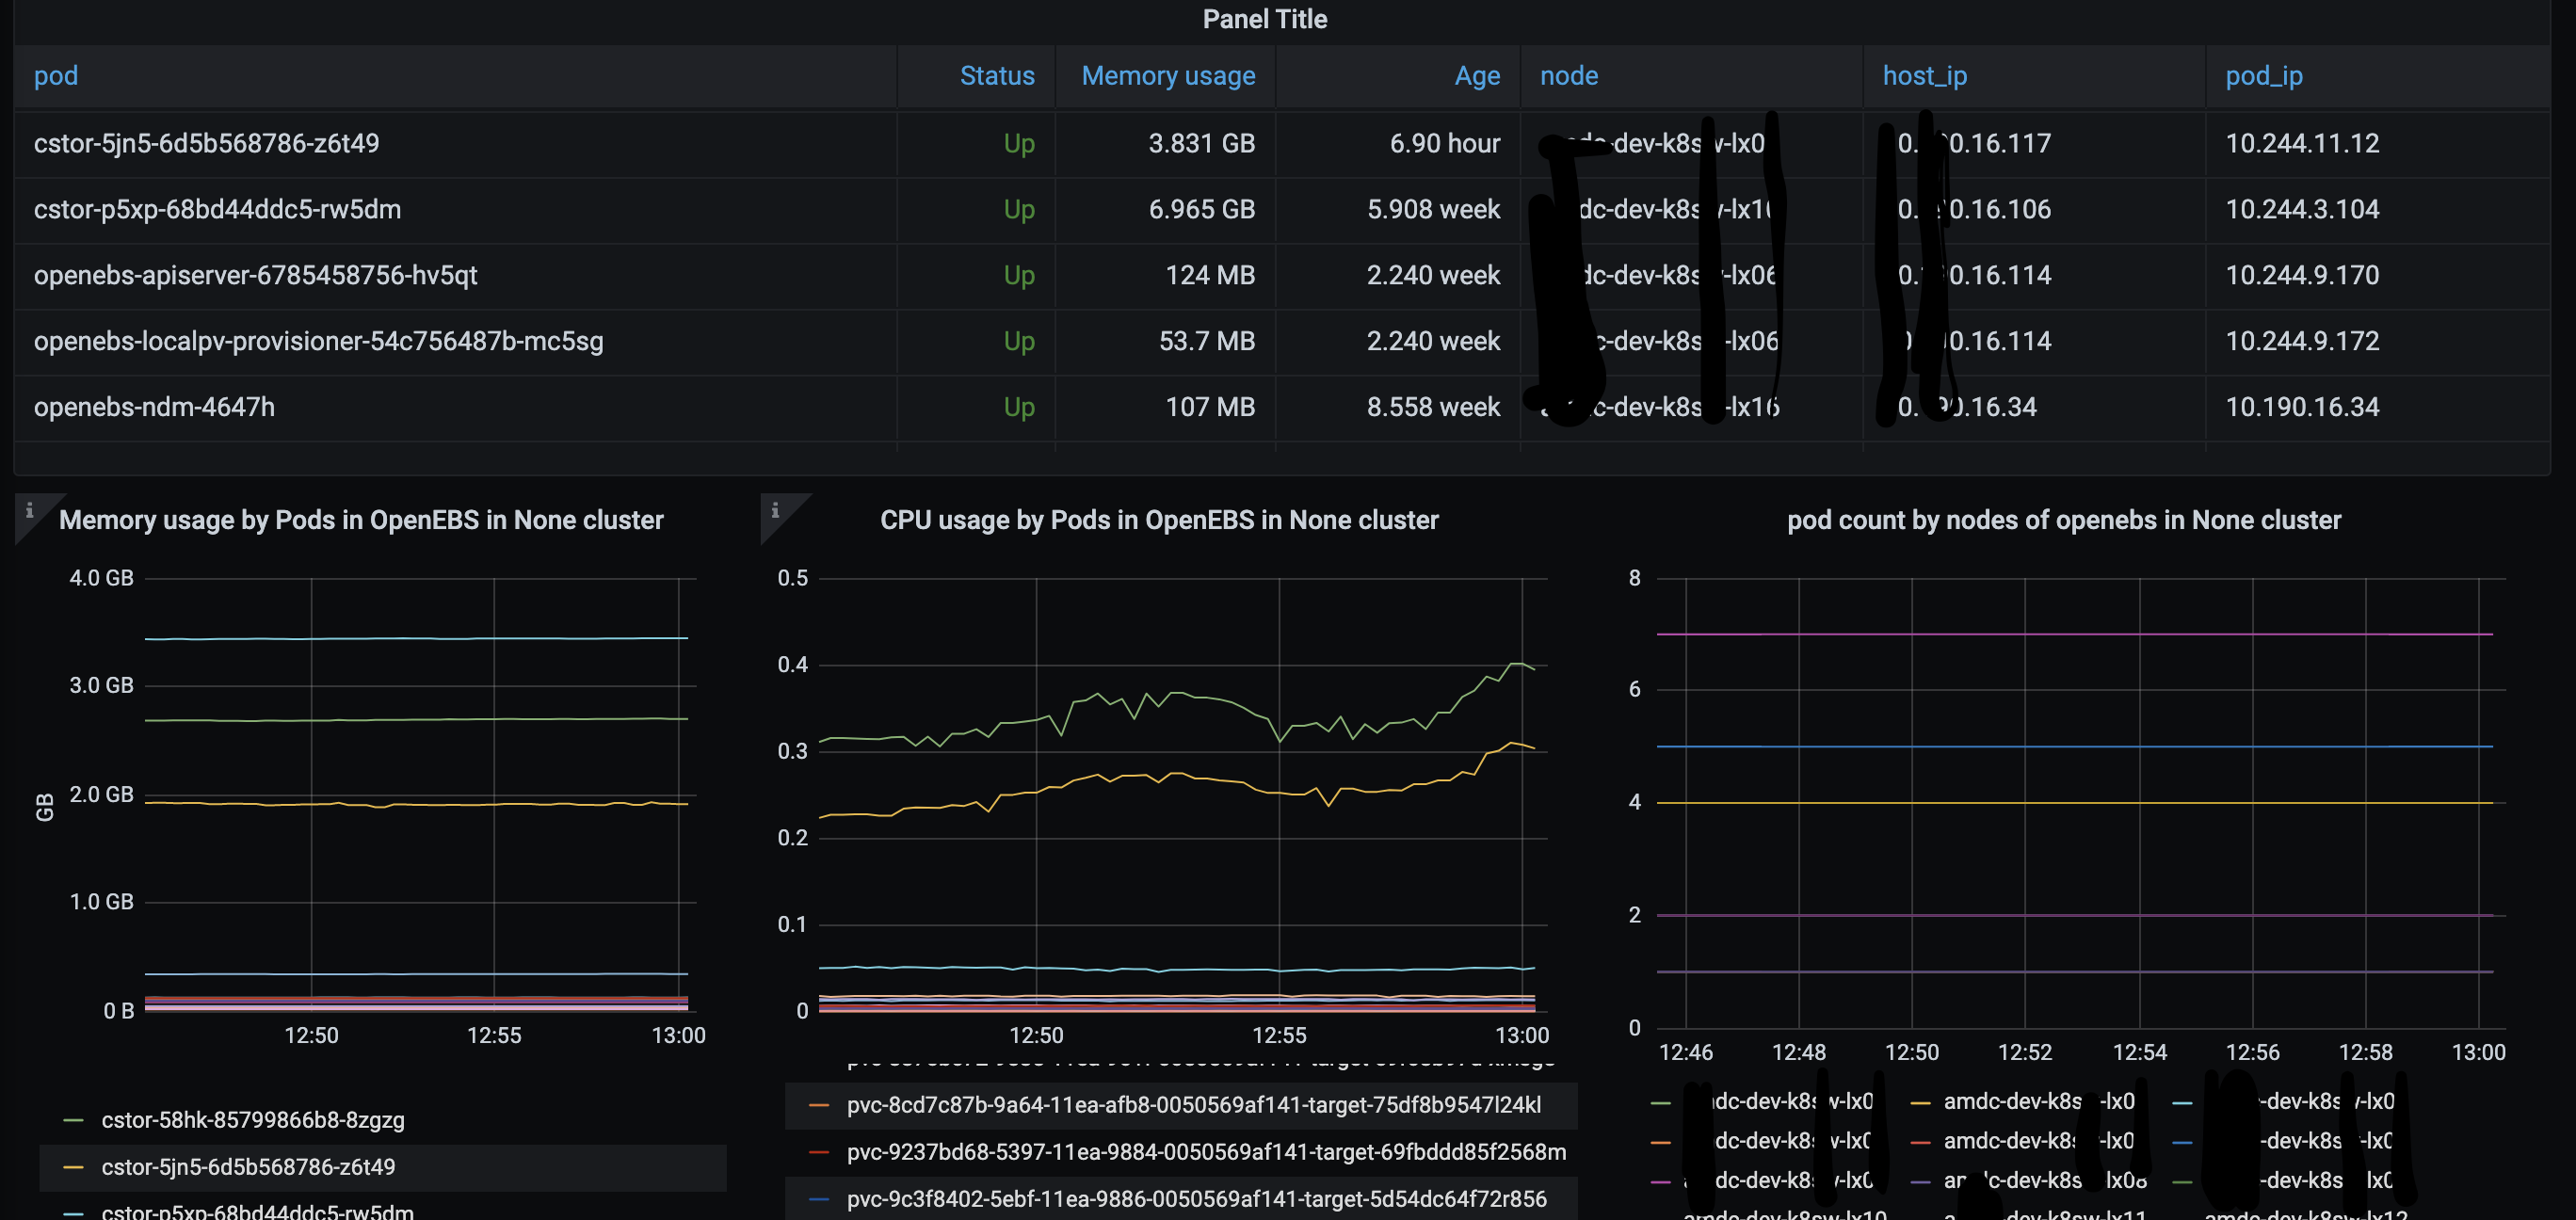
This dashboard provides end-to-end health and capacity visibility for OpenEBS workloads, combining data plane availability, pod lifecycle states, and persistent volume usage across namespaces and clusters. It highlights operational risk through pod readiness, container restarts, and OOMKilled events, while tracking storage capacity with kube_persistentvolumeclaim_info and dynamic namespace metrics such as Memory usage by Pods in OpenEBS and CPU usage by Pods in OpenEBS. Key features include per-cluster and per-namespace views, duration-based error budgets, and agile profiling of ready/waiting/terminated pods, including besteffort and burstable pod classifications.
Screenshots
Used Metrics 2727
-
container_cpu_usage_seconds_total
-
container_memory_usage_bytes
-
container_memory_working_set_bytes
container_spec_memory_reservation_limit_bytes
duration
duration:
kube_persistentvolumeclaim_info
kube_persistentvolumeclaim_status_phase
kube_pod_container_resource_limits_cpu_cores
kube_pod_container_resource_limits_memory_bytes
kube_pod_container_resource_requests_cpu_cores
kube_pod_container_resource_requests_memory_bytes
kube_pod_container_status_ready
kube_pod_container_status_restarts_total
kube_pod_container_status_terminated
kube_pod_container_status_terminated_reason
kube_pod_container_status_waiting
kube_pod_container_status_waiting_reason
kube_pod_info
kube_pod_spec_volumes_persistentvolumeclaims_readonly
kube_pod_start_time
kubelet_volume_stats_available_bytes
kubelet_volume_stats_capacity_bytes
openebs_maya_exporter_version
openebs_total_replica_count
timestamp
-
up