Bind DNS 4,5444,544
This dashboard is designed to display metrics collected by prometheus from the bind_exporter (ISC BIND DNS server). The bind_exporter is created by DigitalOcean and hosted on Github.
Required configuration in /etc/bind/named.conf.options:
statistics-channels {
  inet 127.0.0.1 port 8053 allow { 127.0.0.1; };
};
You need to start the collector with access to the bind(named) pid file and enable the view stats group:
/usr/local/bin/bind_exporter -bind.pid-file /var/run/named/named.pid -bind.stats-groups "server,view,tasks"
This dashboard is an improved version of the official dashboard. It doesn't require aliases to be set in any specific way in the Prometheus config, makes the display more compact, fixes panel group names and other tweaks. It should work out of the box.
Improvements and suggestions for this dashboard are welcome on: https://gitlab.com/anarcat/grafana-dashboards
Used Metrics 2626
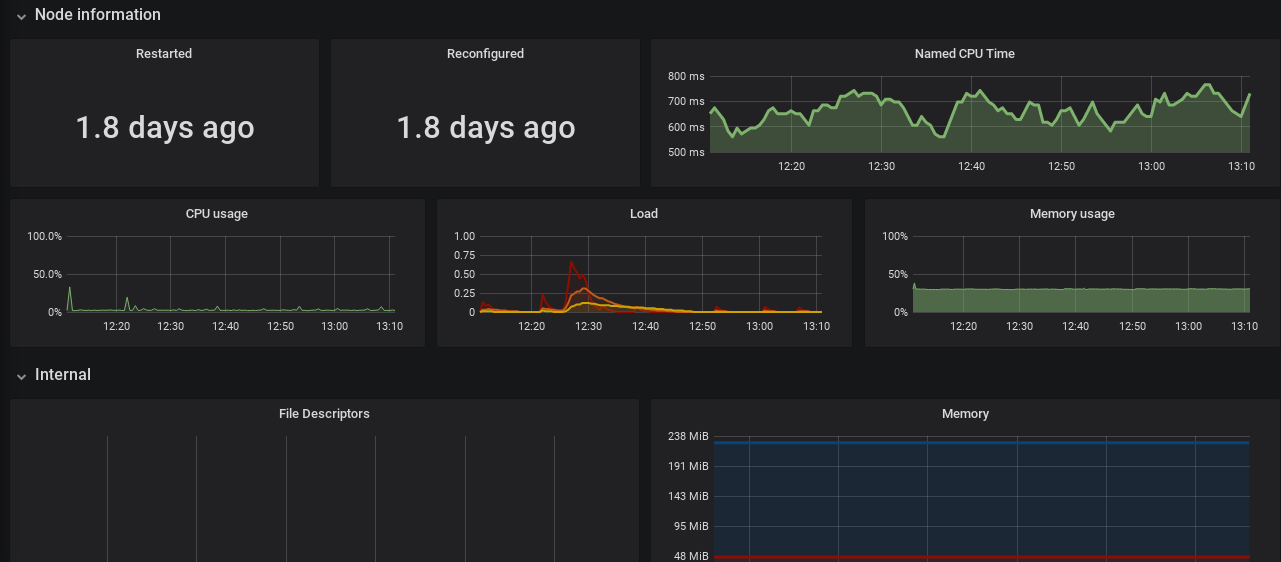
bind_boot_time_seconds
bind_config_time_seconds
bind_process_cpu_seconds_total
-
node_cpu_seconds_total
-
node_load1
-
node_load5
-
node_load15
-
node_memory_MemAvailable_bytes
-
node_memory_MemTotal_bytes
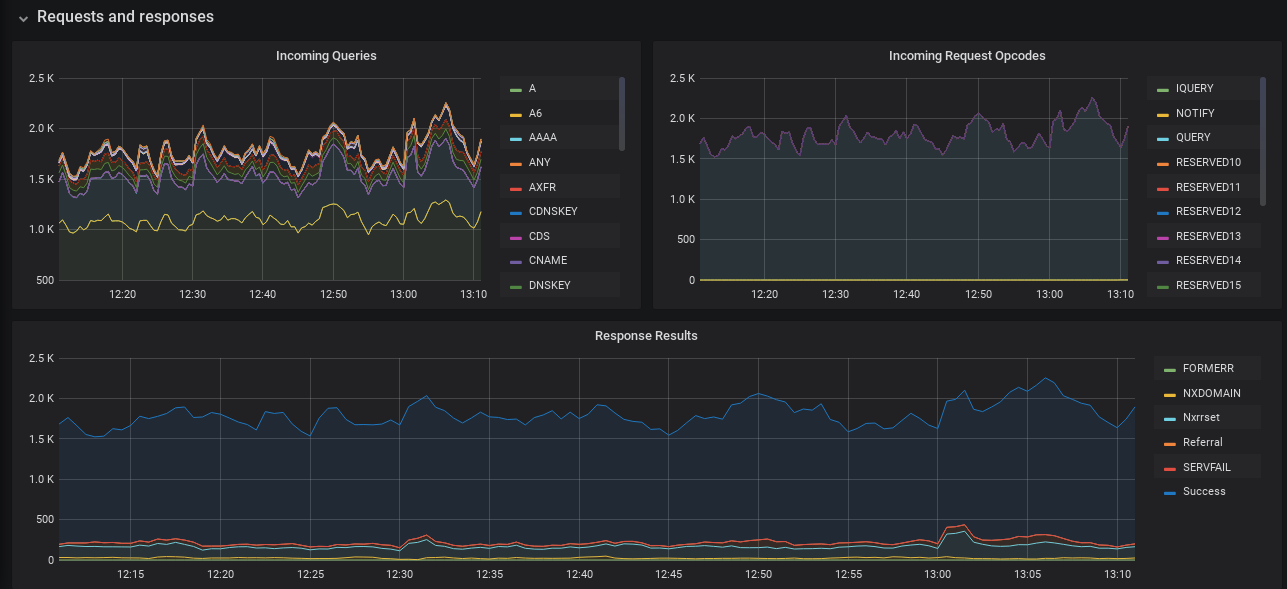
bind_incoming_queries_total
bind_incoming_requests_total
bind_responses_total
bind_query_duplicates_total
bind_query_errors_total
bind_query_recursions_total
bind_cache_rrsets
bind_resolver_dnssec_validation_errors_total
bind_resolver_dnssec_validation_success_total
bind_resolver_query_errors_total
bind_resolver_query_edns0_errors_total
bind_resolver_query_retries_total
bind_resolver_query_duration_seconds_bucket
bind_resolver_response_errors_total
bind_resolver_response_lame_total
bind_resolver_response_mismatch_total
bind_resolver_response_truncated_total