Linux Hosts Metrics | Base 32,28132,281 3.3 (3 reviews)
5/10/2019
6/3/2019
1
Host Metrics
>=6.1.6
Prometheus
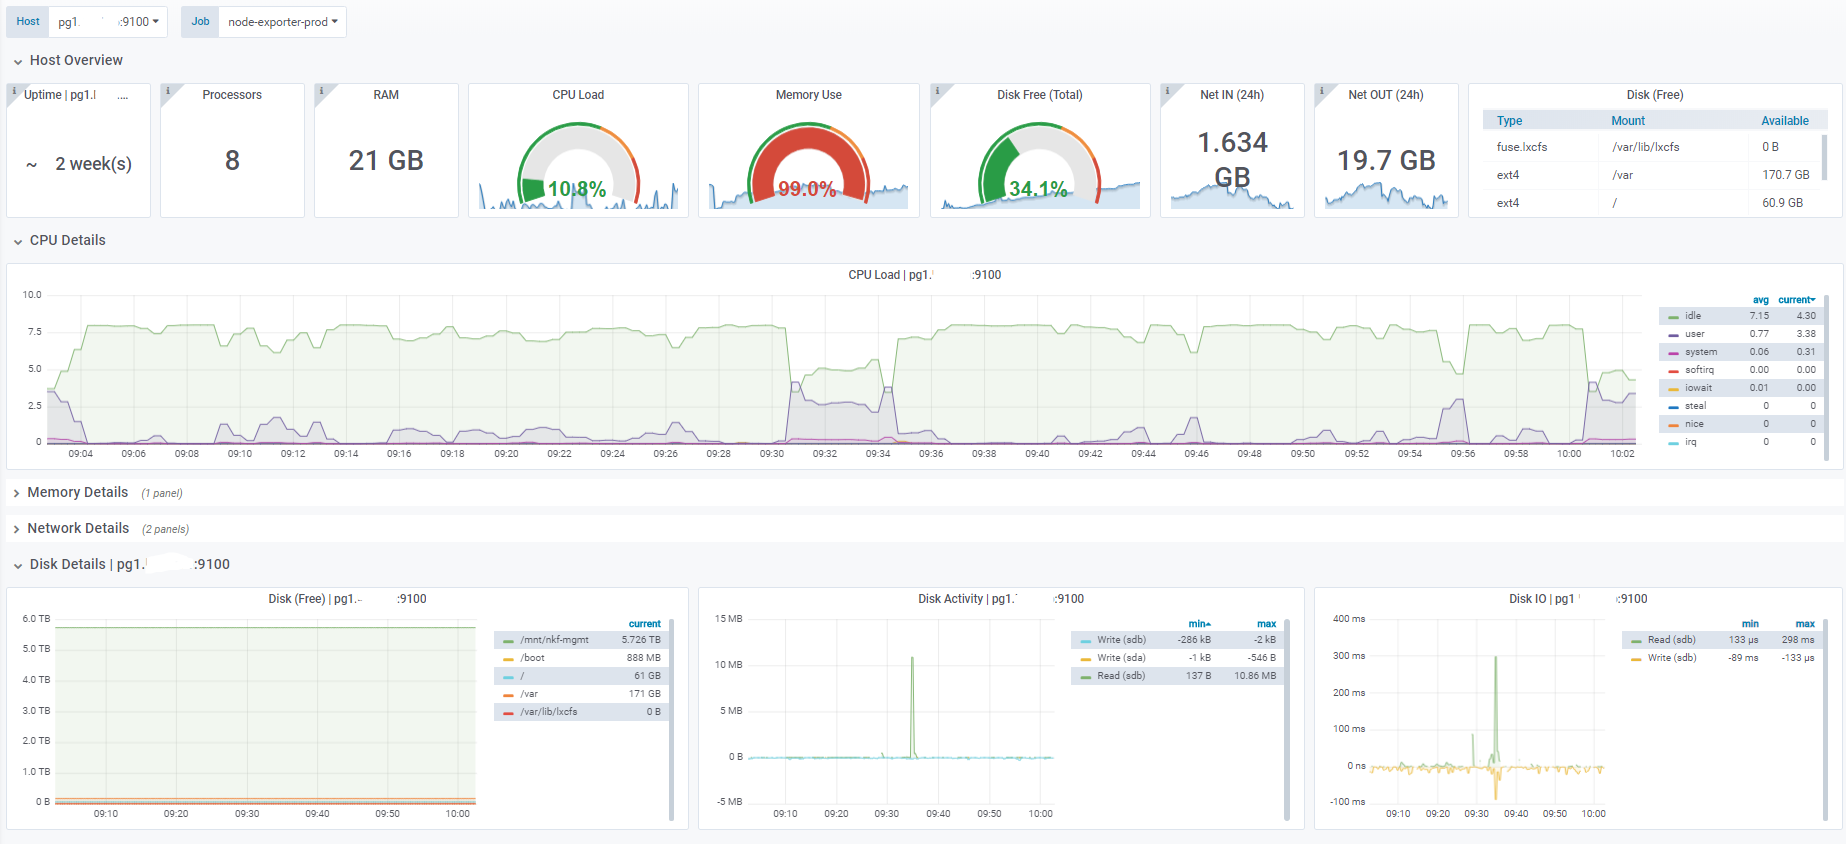
This dashboards gives a basic overview of linux host metrics.
- Host & Job-filters, based on "node_boot_time_seconds" metric
- Multiple instances can be selected/shown at the same time
NOTE: Only tested with a resolution of 1920x1080. The fields/metrics are set to stack vertically when more than 1 node i selected, so you might want to limit the view to only 1 node at a time on lower resolutions
Export Dashboard✕
Download
Copy to Clipboard
Used Metrics 1313
-
node_time_seconds
-
node_boot_time_seconds
-
node_cpu_seconds_total
-
node_memory_MemTotal_bytes
-
node_memory_MemFree_bytes
-
node_filesystem_free_bytes
-
node_filesystem_size_bytes
-
node_network_receive_bytes_total
-
node_network_transmit_bytes_total
-
node_disk_read_bytes_total
-
node_disk_written_bytes_total
-
node_disk_read_time_seconds_total
-
node_disk_write_time_seconds_total