Besu Overview 483,021483,021 5.0 (1 reviews)
Besu Overview
Provides a dashboard for monitoring a Besu Ethereum node. The required data is exported directly from Besu to a Prometheus data store. See the documentation on how to configure Besu and Prometheus.
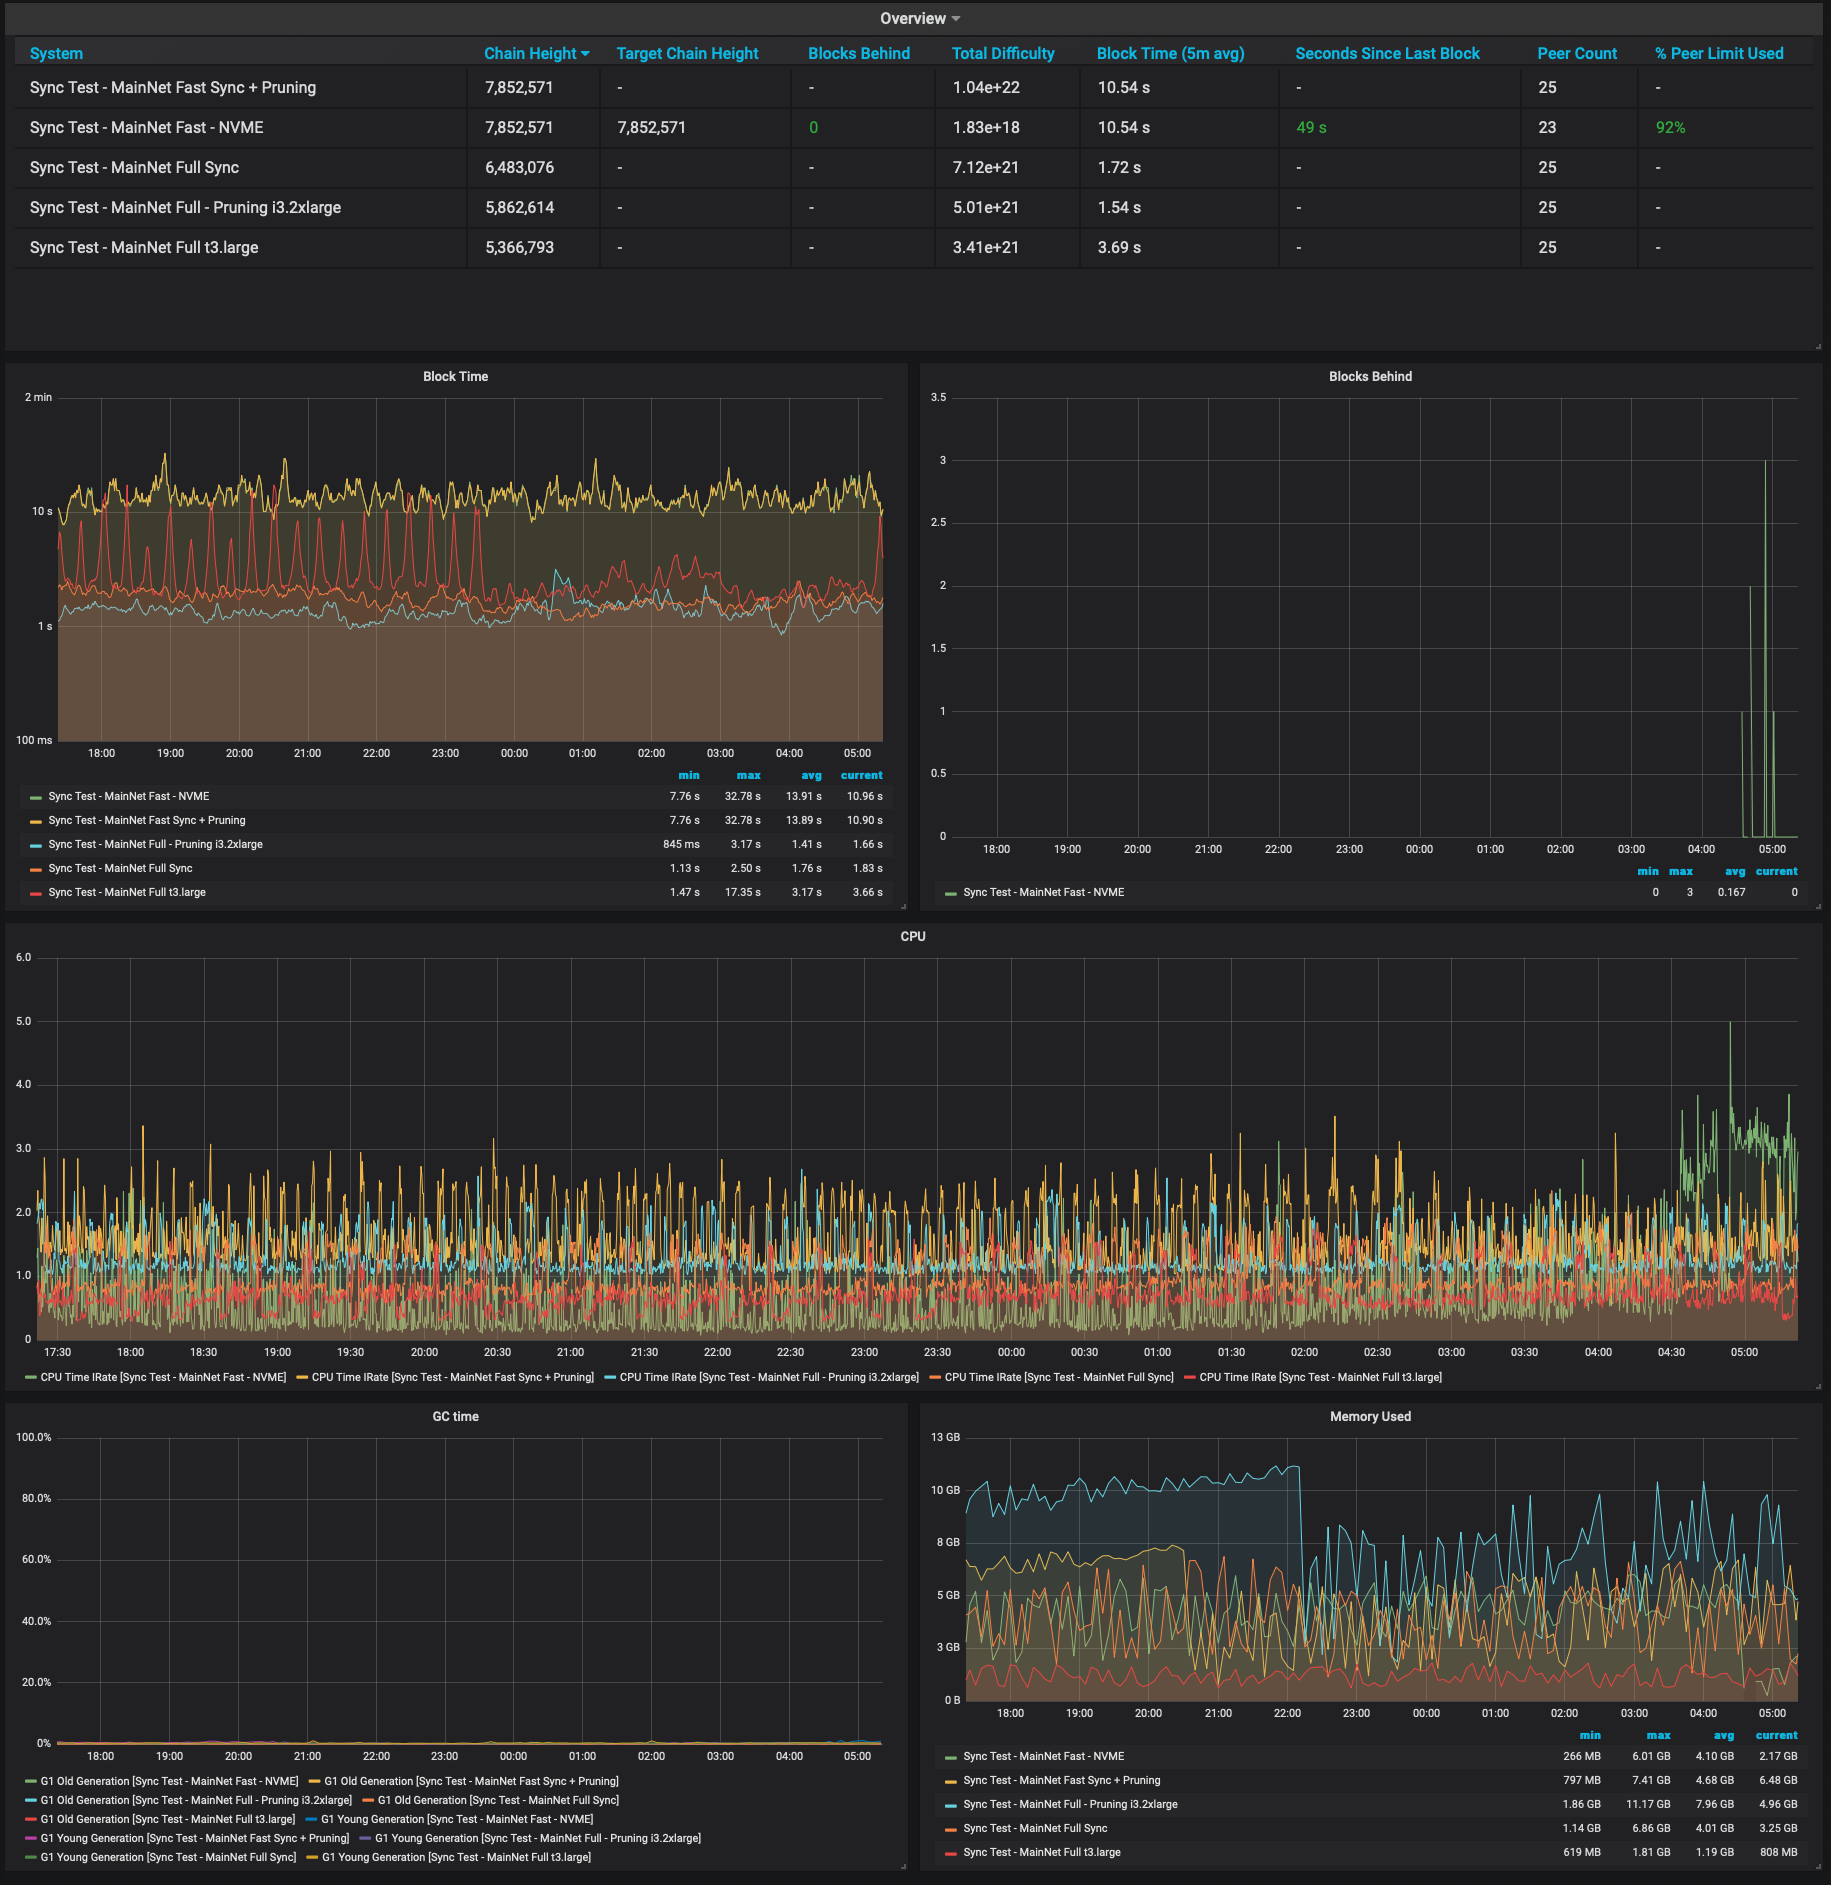
The dashboard provides information on how well connected Besu is to the network, sync state, block import rate, along with CPU and memory usage statistics.
Used Metrics 1616
besu_blockchain_height
ethereum_blockchain_height
besu_synchronizer_best_known_block
ethereum_best_known_block_number
besu_blockchain_difficulty_total
besu_blockchain_chain_head_timestamp
besu_peers_peer_count_current
ethereum_peer_count
besu_network_peers_limit
ethereum_peer_limit
besu_synchronizer_world_state_pending_requests_current
besu_synchronizer_fast_sync_pivot_block_current
besu_synchronizer_world_state_completed_requests_total
-
process_cpu_seconds_total
jvm_gc_collection_seconds_sum
jvm_memory_bytes_used