K8 Cluster Detail Dashboard 94,47694,476 4.0 (1 reviews)
9/13/2019
9/13/2019
1
>=6.2.5
Prometheus
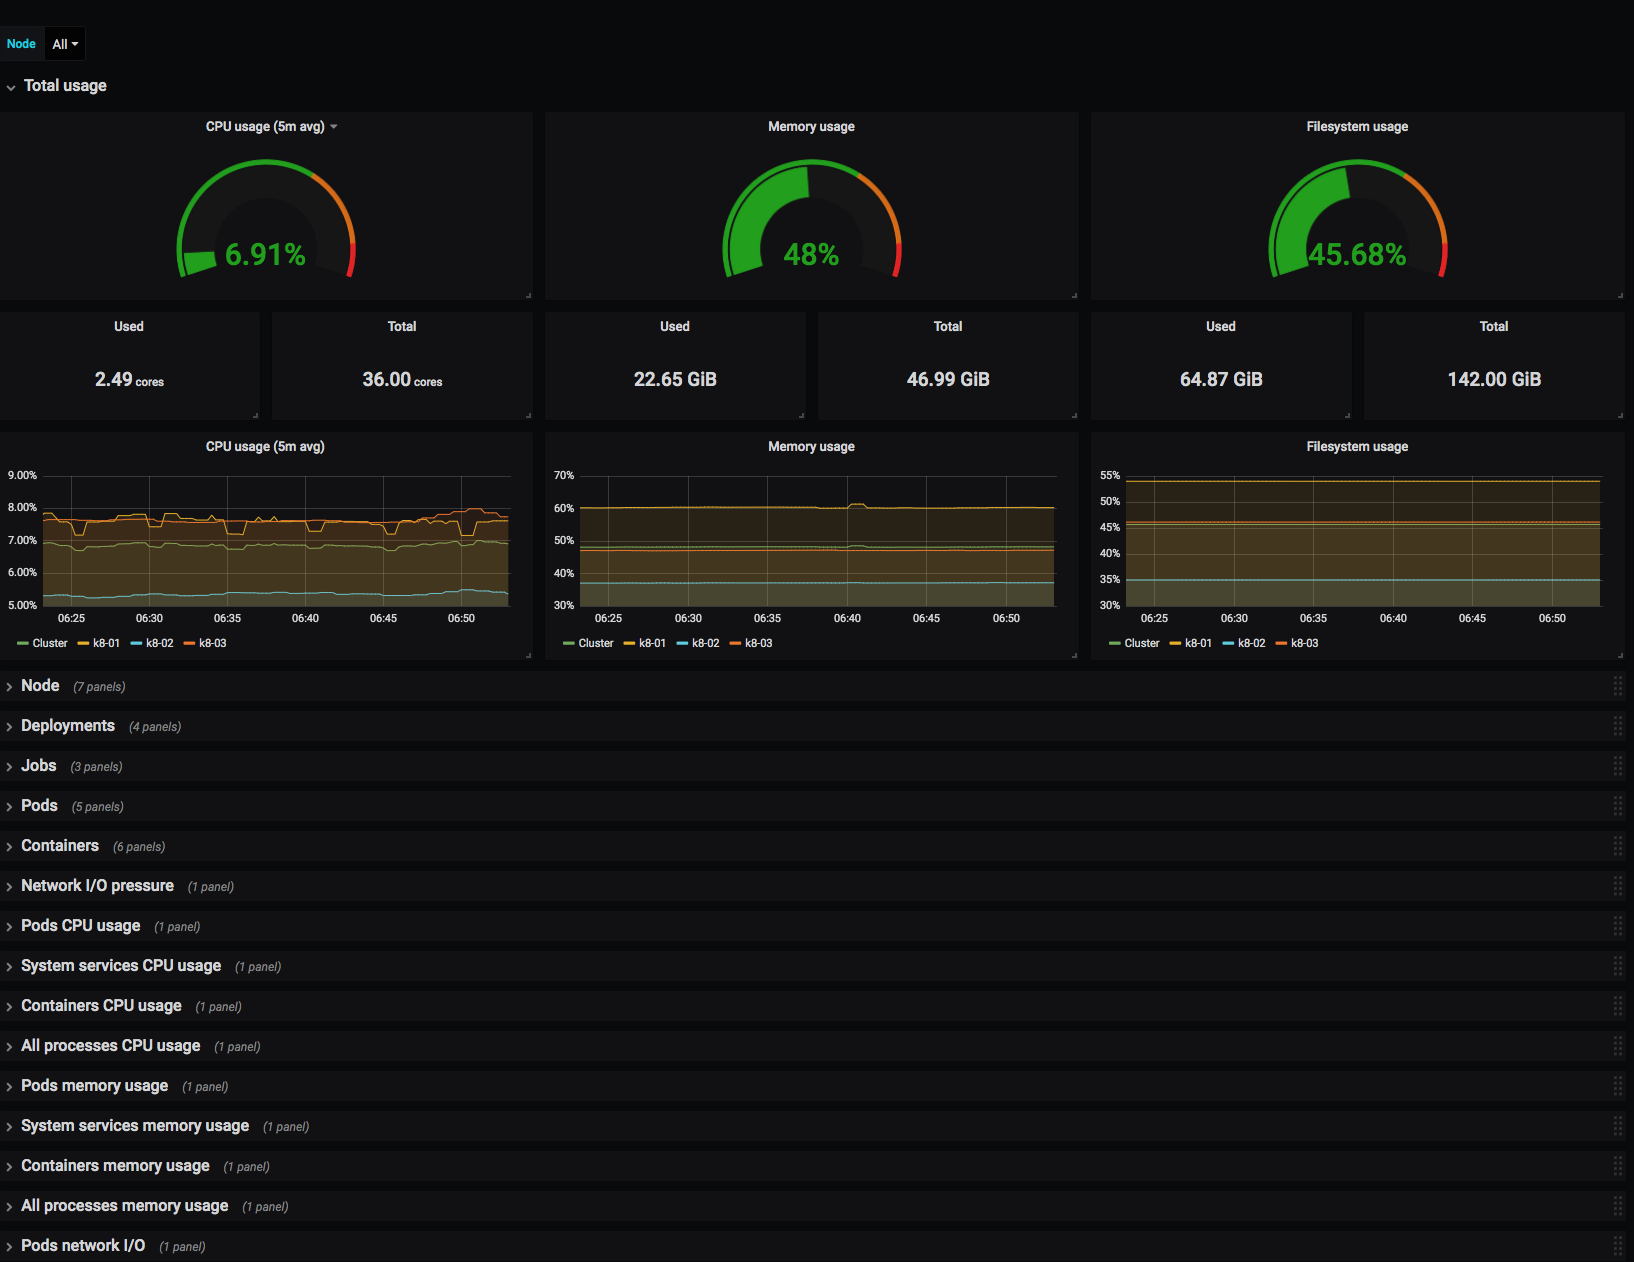
Monitors Kubernetes cluster using Prometheus. Shows overall cluster or Node CPU / Memory / Filesystem usage as well as individual pod, containers, systemd services statistics. Uses cAdvisor metrics only.
Export Dashboard✕
Download
Copy to Clipboard