Spinnaker Microservices 783783 4.3 (3 reviews)
11/18/2019
11/18/2019
1
AWSDockerHost MetricsWeb Servers
>=6.4.2
Prometheus
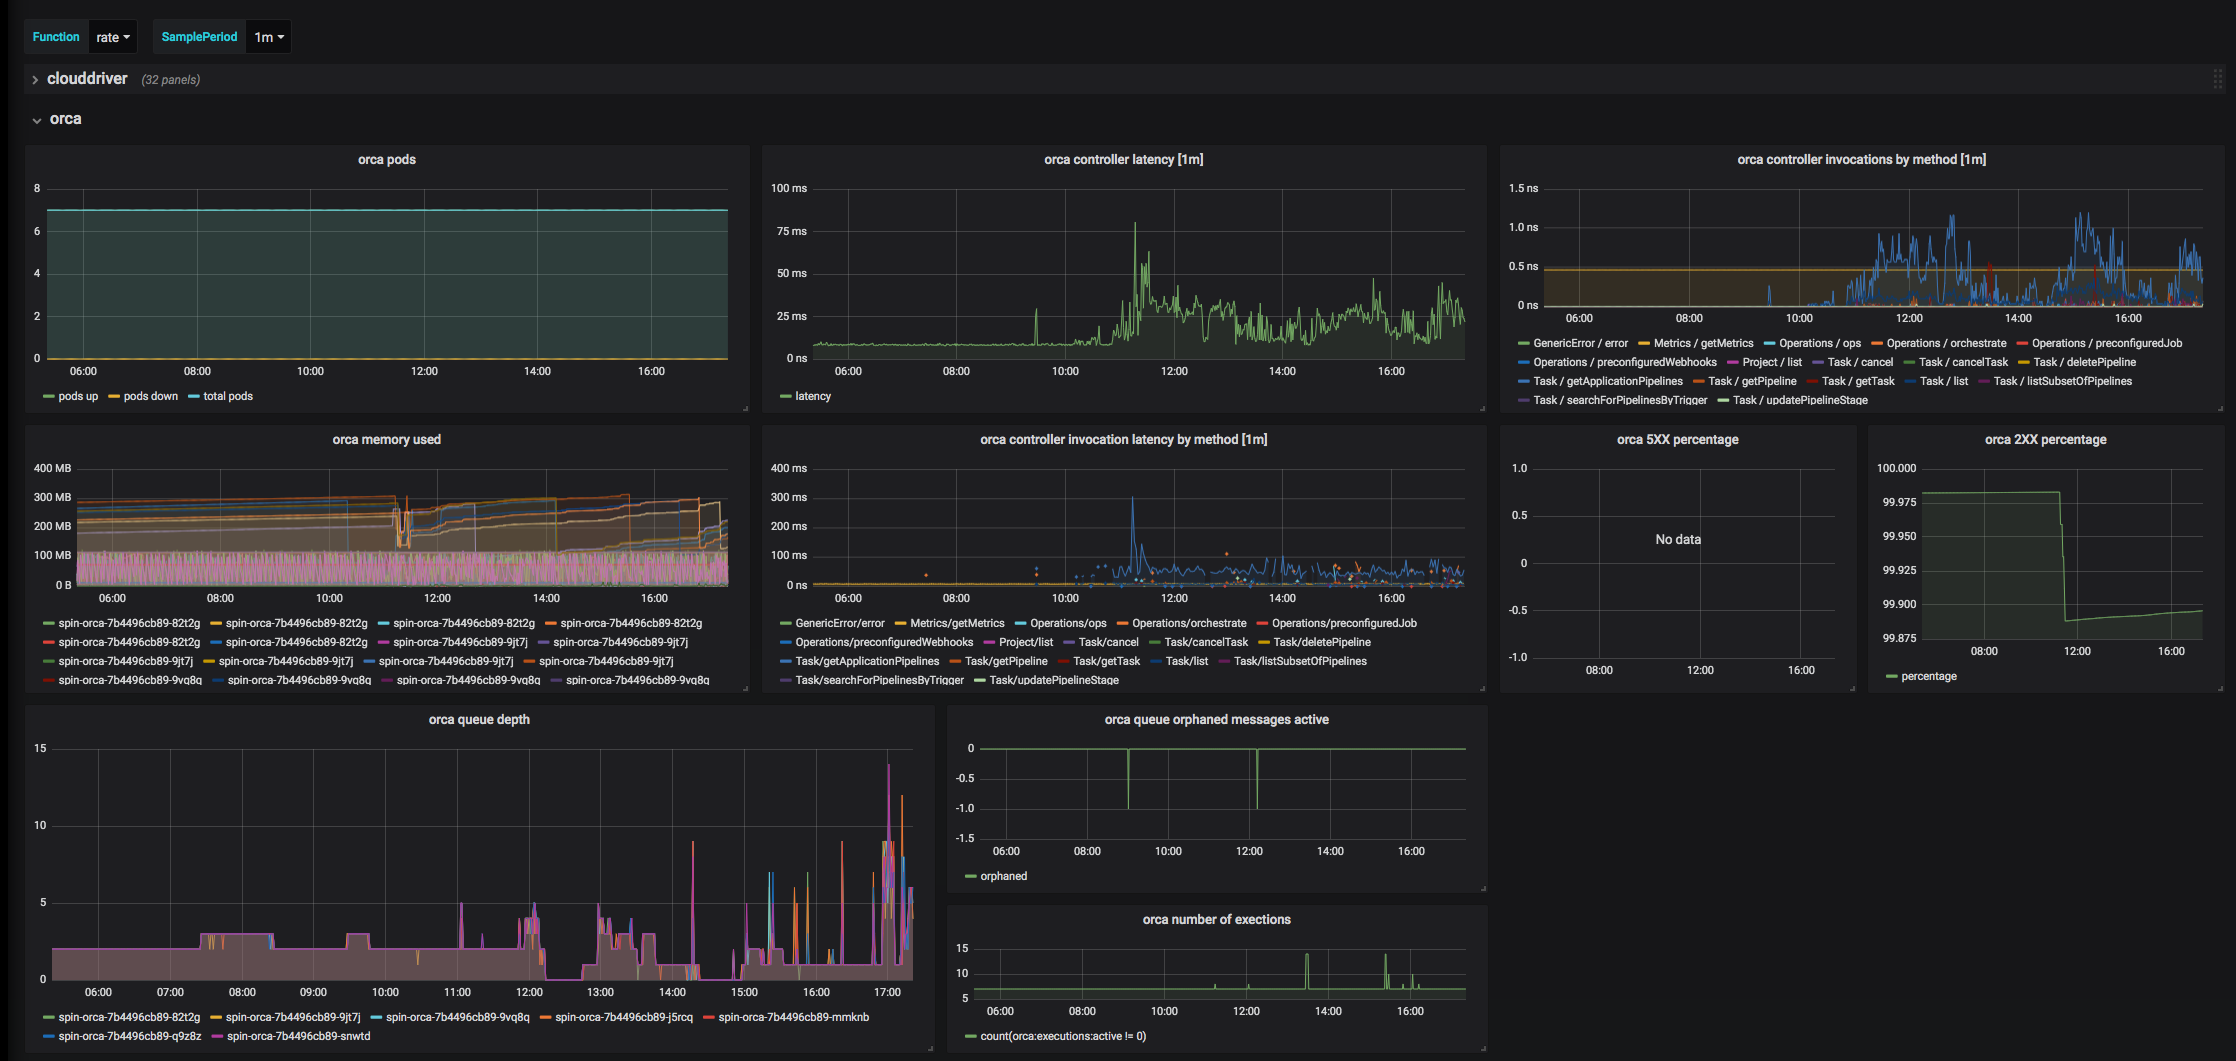
- All in one dashboard for all of Spinnaker's microservices: Clouddriver, Orca, Gate, Igor, Fiat, Front50, Rosco, Echo. Others will be added
- Uses Prometheus as DataSource
- Uses the latest updated Spinnaker metrics
- Works for environments that use AuroraDB/SQL for caching instead of Redis
- Works for multiple read replica clusters for Clouddriver: clouddriver_caching, clouddriver_rw, clouddriver_ro, clouddriver_ro_deck
- Still has some functions not working (in progress)
Export Dashboard✕
Download
Copy to Clipboard
Used Metrics 1818
-
up
clouddriver_caching:controller:invocations__totalTime_total
SamplePeriod
clouddriver_caching:controller:invocations__count_total
controller
Controller
clouddriver_caching:jvm:memory:used
clouddriver_rw:controller:invocations__totalTime_total
clouddriver_rw:controller:invocations__count_total
clouddriver_rw:jvm:memory:used
clouddriver_ro:controller:invocations__totalTime_total
clouddriver_ro:controller:invocations__count_total
clouddriver_ro:jvm:memory:used
clouddriver_ro_deck:controller:invocations__totalTime_total
clouddriver_ro_deck:controller:invocations__count_total
clouddriver_ro_deck:jvm:memory:used
clouddriver_caching:kubernetes:api__count_total
clouddriver_caching:kubernetes:api__totalTime_total