SSL Exporter Simple 1,2421,242
11/26/2019
11/26/2019
1
Web Servers
>=6.4.2
Prometheus
Simple dashboard to use with ssl-exporter
https://github.com/rolep/grafana-ssl-exporter-simple
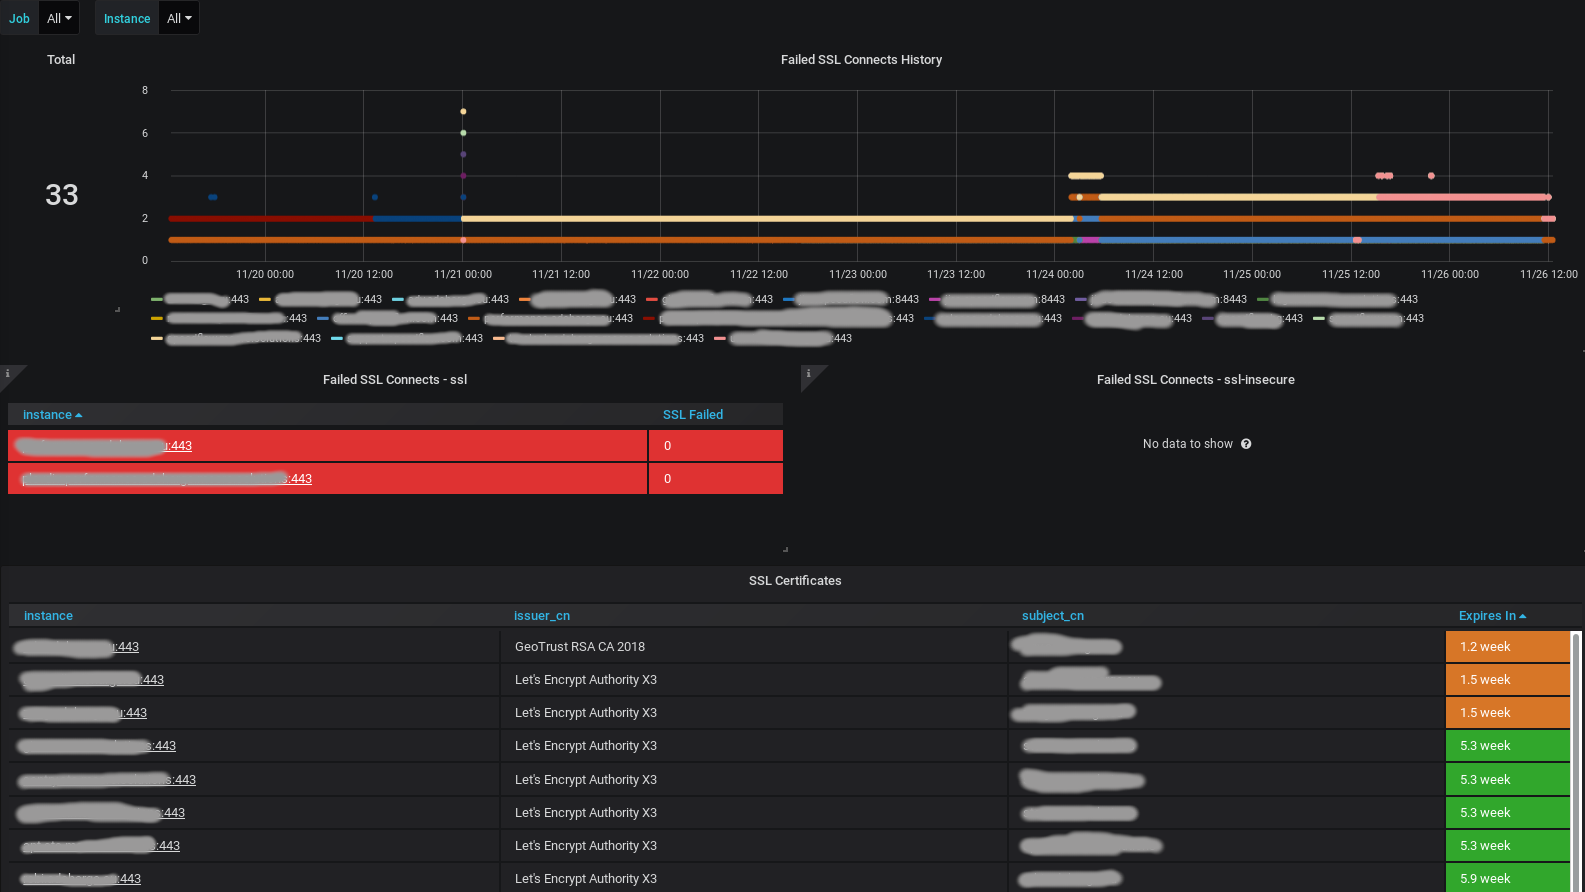
Shows:
- Total number of domains in job
- History time graph of failed ssl-checks
- Table with current failed ssl-checks
- Table with all domains, certificate issuer, how much time left until certificate expiry
- Filters by job (primary for secure / insecure checks), domain (primary for history graph filter)
It is recommended to use default exporter value and verify certitificates.
Example ssl-exporter job configuration:
 - job_name: 'ssl'
    metrics_path: /probe
    scrape_interval: 2m
    static_configs:
      - targets:
        - 'my.server.com:443'
    relabel_configs:
      - source_labels: [__address__]
        target_label: __param_target
      - source_labels: [__param_target]
        target_label: instance
      - target_label: __address__
        replacement: ssl-exporter:9219  # SSL exporter instance
If you have services which use not publicly verifiable certificates (i.e. internal or self-signed, services on custom port, etc)
it is better to have another scrape job ssl-insecure connecting to different instance of ssl-exporter container,
launched with config option --tls.insecure=true.
Export Dashboard✕
Download
Copy to Clipboard
Used Metrics 77
ssl_tls_connect_success
-
up
ssl_cert_not_after
dnsnames
ssl_cert_subject_alternative_dnsnames
subject_cn
ssl_cert_subject_common_name