Prometheus Internal Stats 2,8622,862
12/20/2019
3/23/2020
2
>=6.7.0-beta1
Prometheus
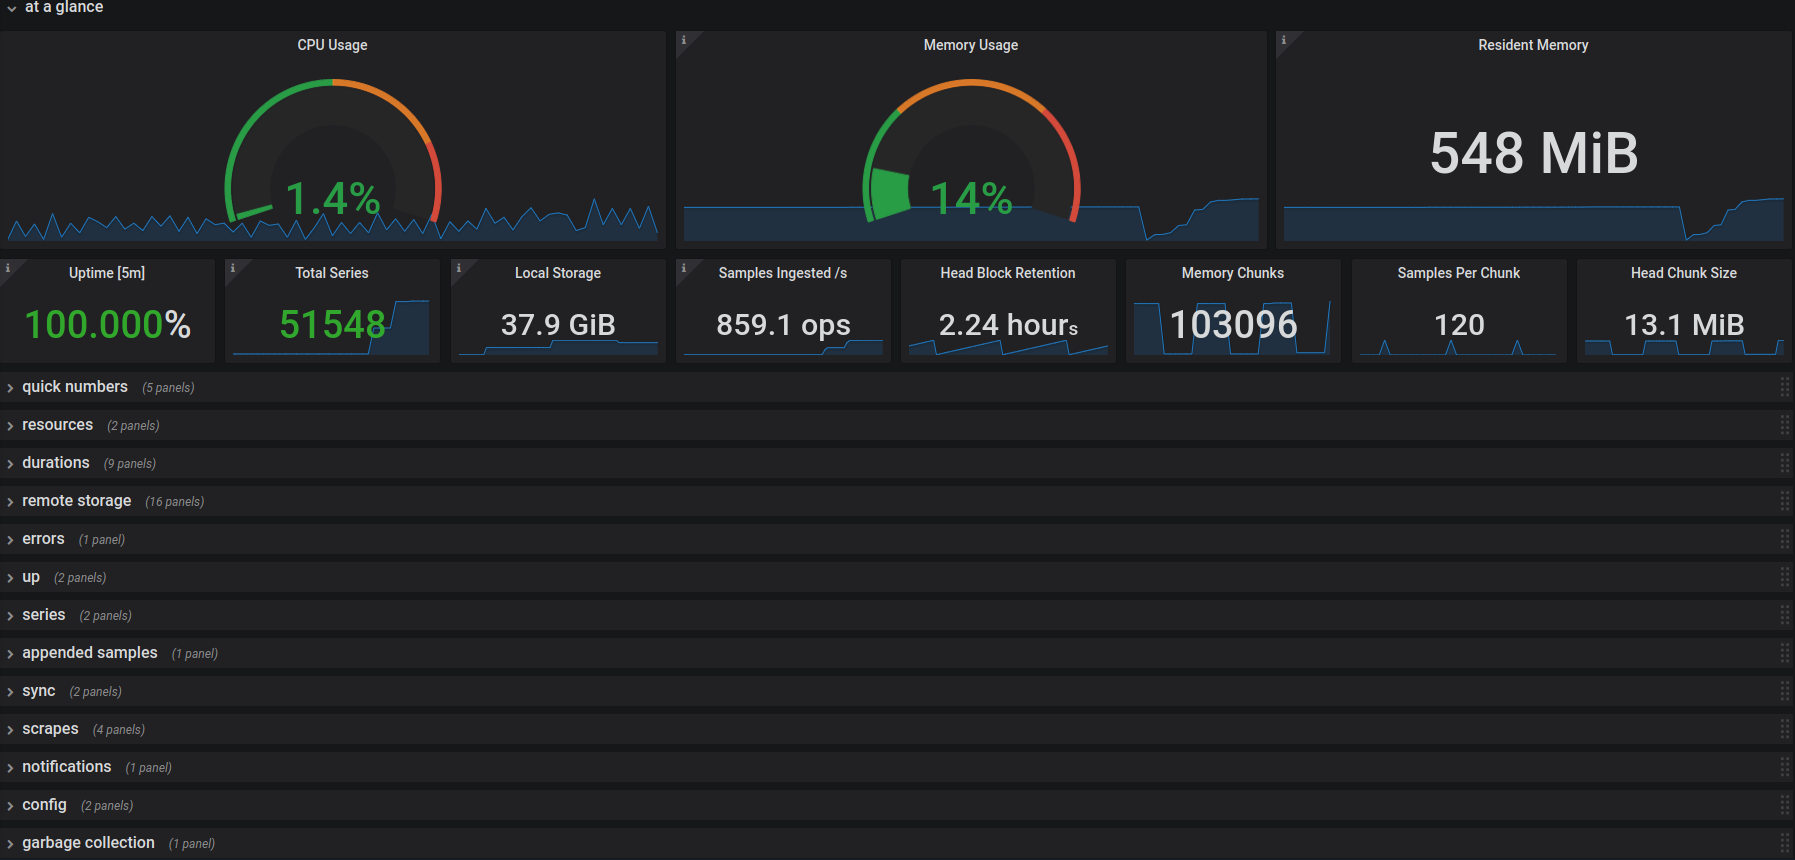
Prometheus Internal Stats
Extending the default dashboard with more debug-relevant metrics.
Shows metrics about:
- Resources
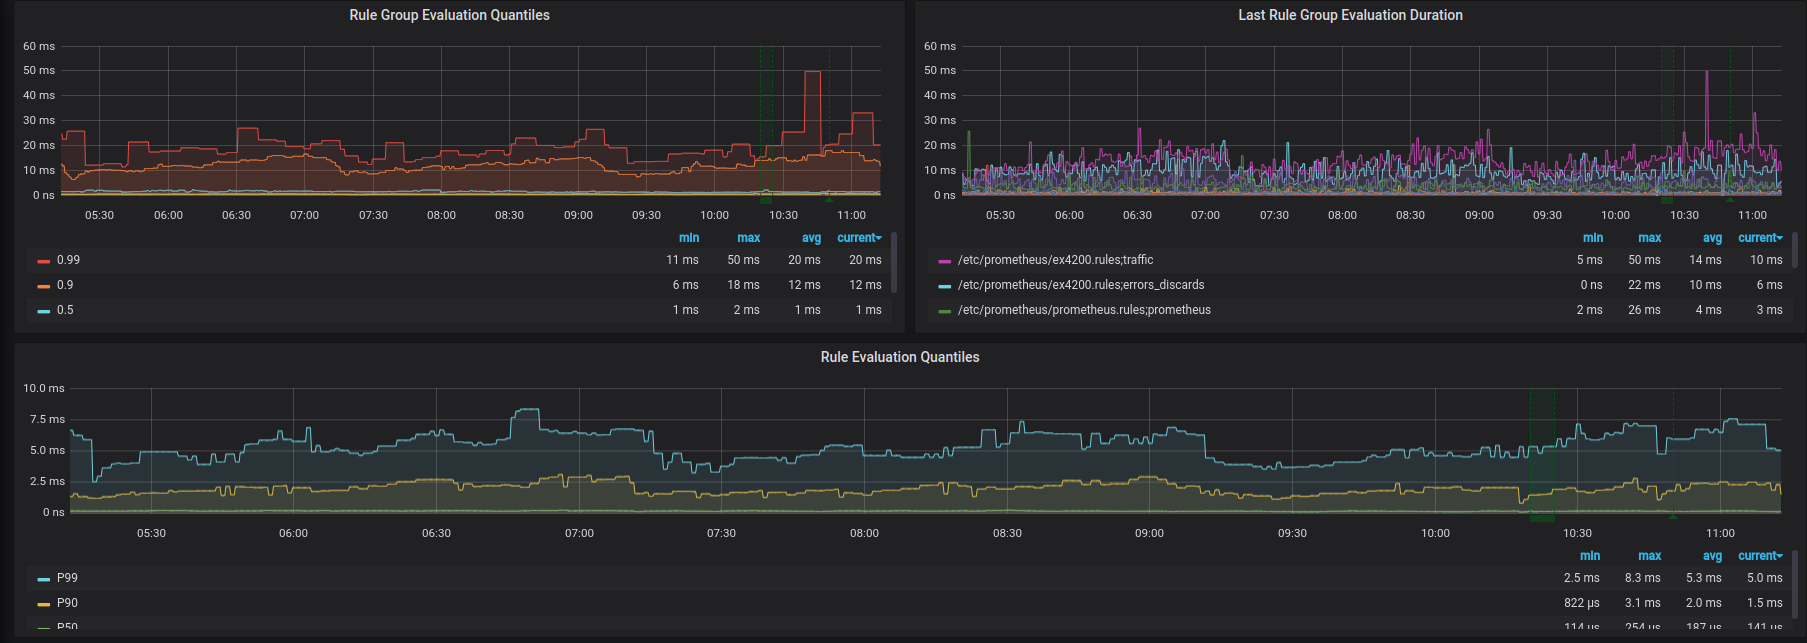
- Rule durations
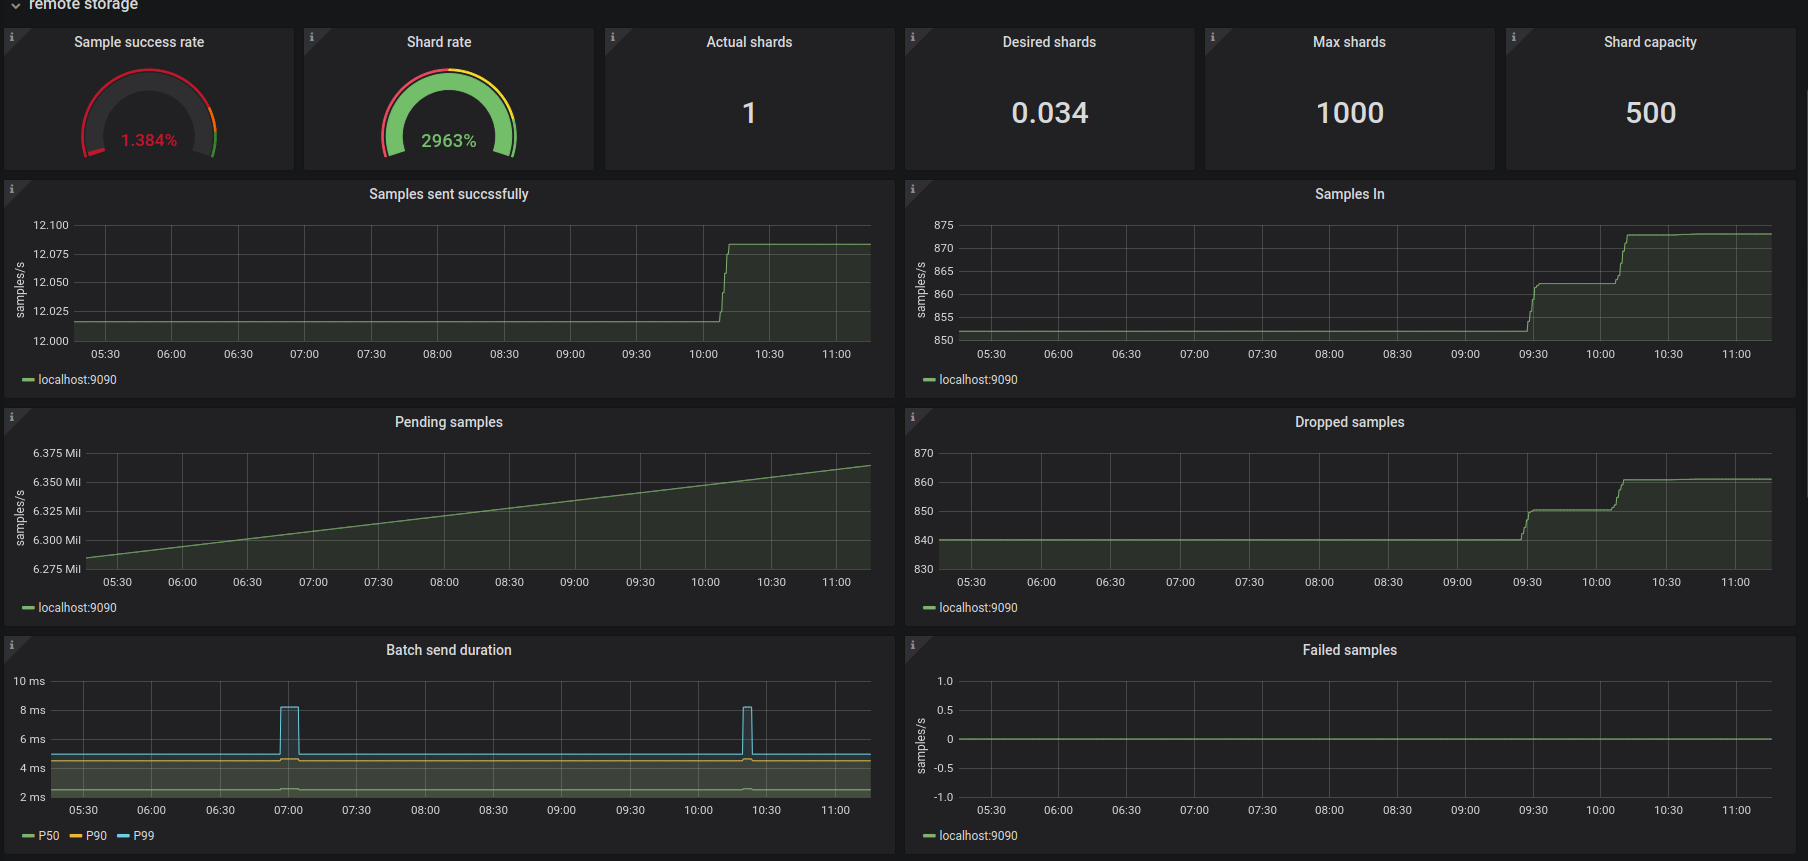
- Remote storage
- Errors
- Samples
- Sync
- Scrapes
- Notifications
- Config
- GC
Export Dashboard✕
Download
Copy to Clipboard
Used Metrics 1313
-
process_cpu_seconds_total
interval
-
process_resident_memory_bytes
-
node_memory_MemTotal_bytes
-
up
-
prometheus_tsdb_head_series
-
prometheus_tsdb_storage_blocks_bytes
-
prometheus_tsdb_head_samples_appended_total
-
prometheus_tsdb_head_max_time
-
prometheus_tsdb_head_min_time
-
prometheus_tsdb_head_chunks
prometheus_tsdb_compaction_chunk_samples_sum
prometheus_tsdb_compaction_chunk_samples_count