K8s / Storage / Volumes / Cluster 23,823,23923,823,239 4.0 (2 reviews)
12/21/2019
12/22/2019
14
>=6.5.2
Prometheus
Overview
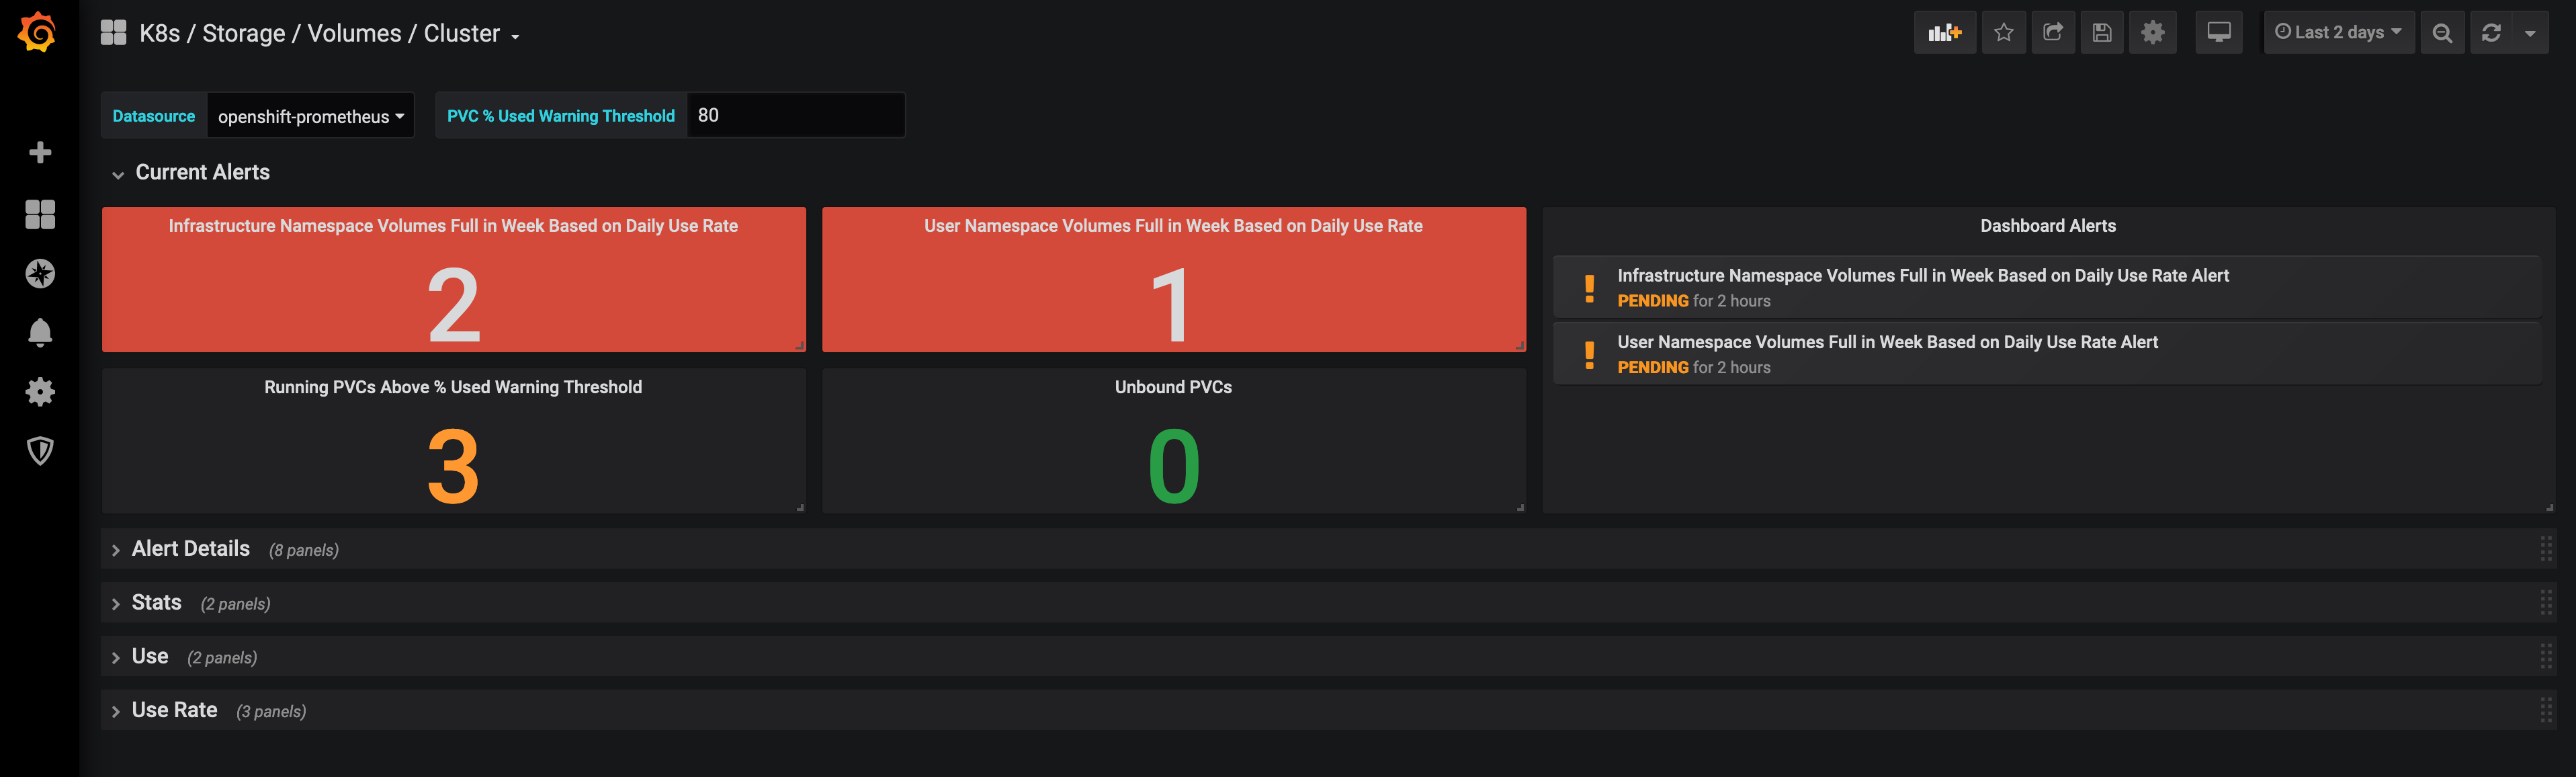
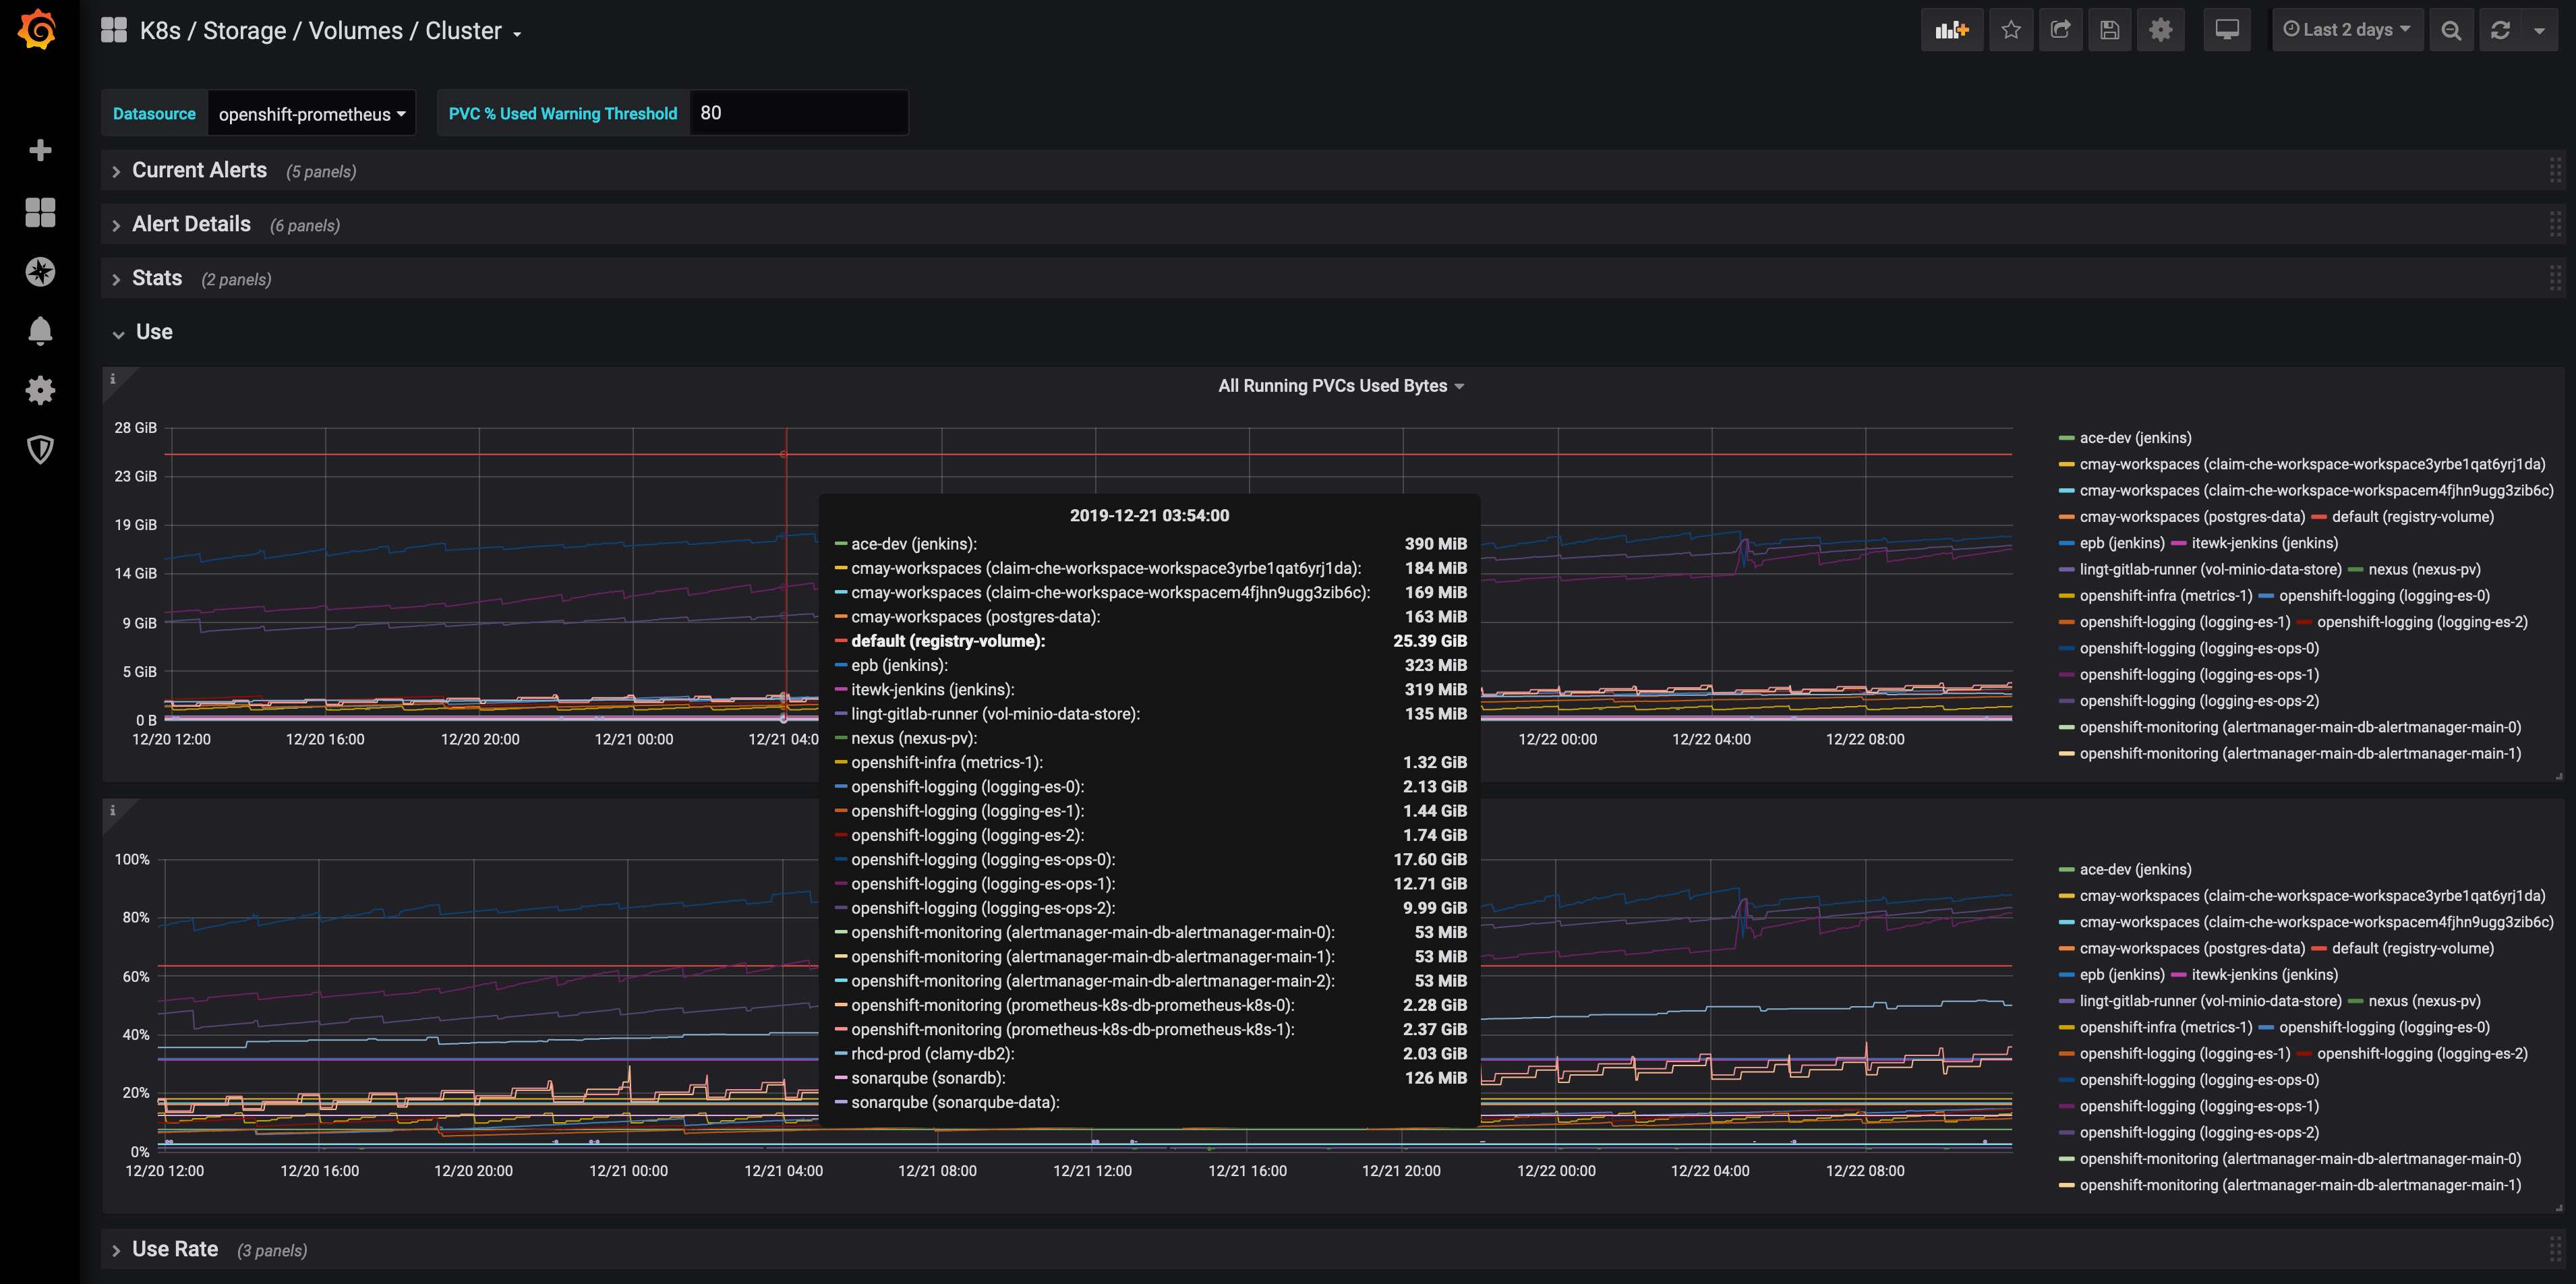
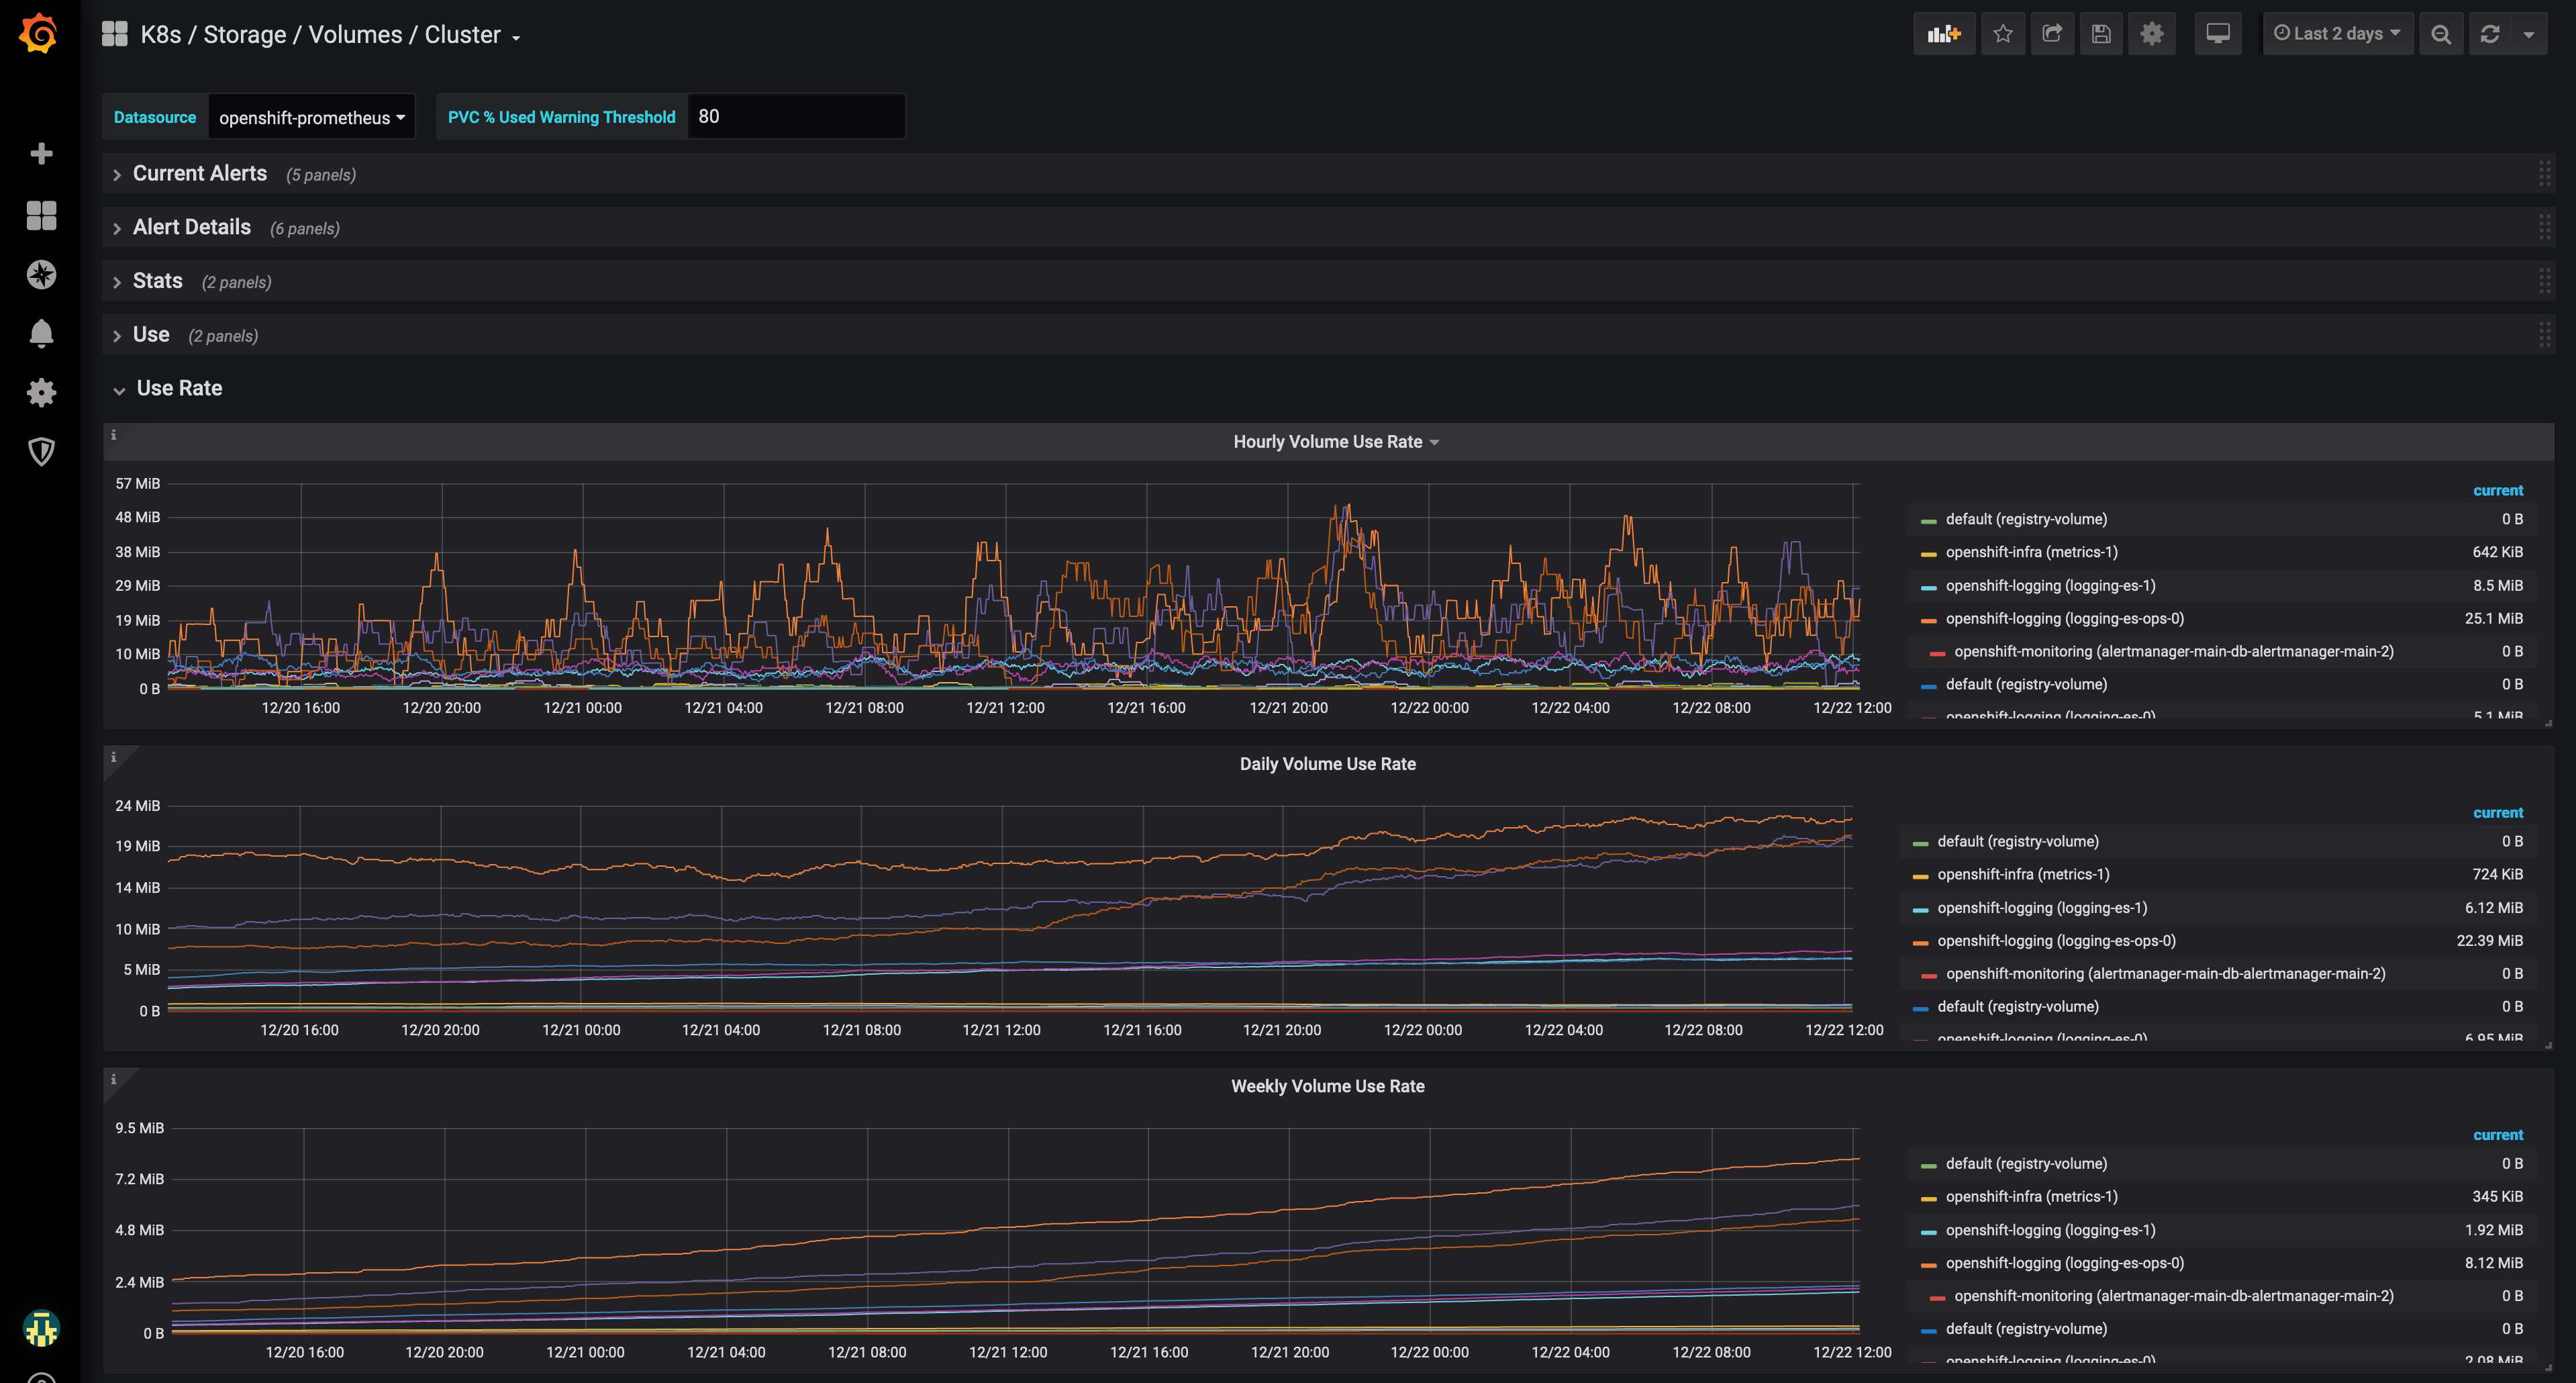
Dashboard of Kubernetes / OpenShift volume information at cluster level as exported by Prometheus connected to Kubernetes / OpenShift.
Expects
pv_collector_bound_pvc_countpv_collector_unbound_pvc_countkube_persistentvolumeclaim_infokubelet_volume_stats_used_byteskubelet_volume_stats_available_byteskubelet_volume_stats_capacity_bytes
Published Grafana Alerts
Infrastructure Namespace Volumes Full in Week Based on Daily Use Rate AlertUser Namespace Volumes Full in Week Based on Daily Use Rate Alert
Documentation
- Set up Prometheus on OpenShift - Red Hat OpenShiftr Container Platform 3.11: Configuring Clusters: Prometheus Cluster Monitoring
Tested With
- OpenShift Container Platform (OCP)
- v3.11.154
- OpenShift Container Storage (OCS)
- 3.11
- Grafana
- v6.5.2
- Prometheus
- v2.3.2
Related Boards
Export Dashboard✕
Download
Copy to Clipboard
Used Metrics 55
kubelet_volume_stats_available_bytes
kubelet_volume_stats_used_bytes
kubelet_volume_stats_capacity_bytes
pvc_percent_used_warning_threshold
pv_collector_unbound_pvc_count