JVM (Micrometer)- Kubernetes - Prometheus by Istio 37,27537,275 5.0 (1 reviews)
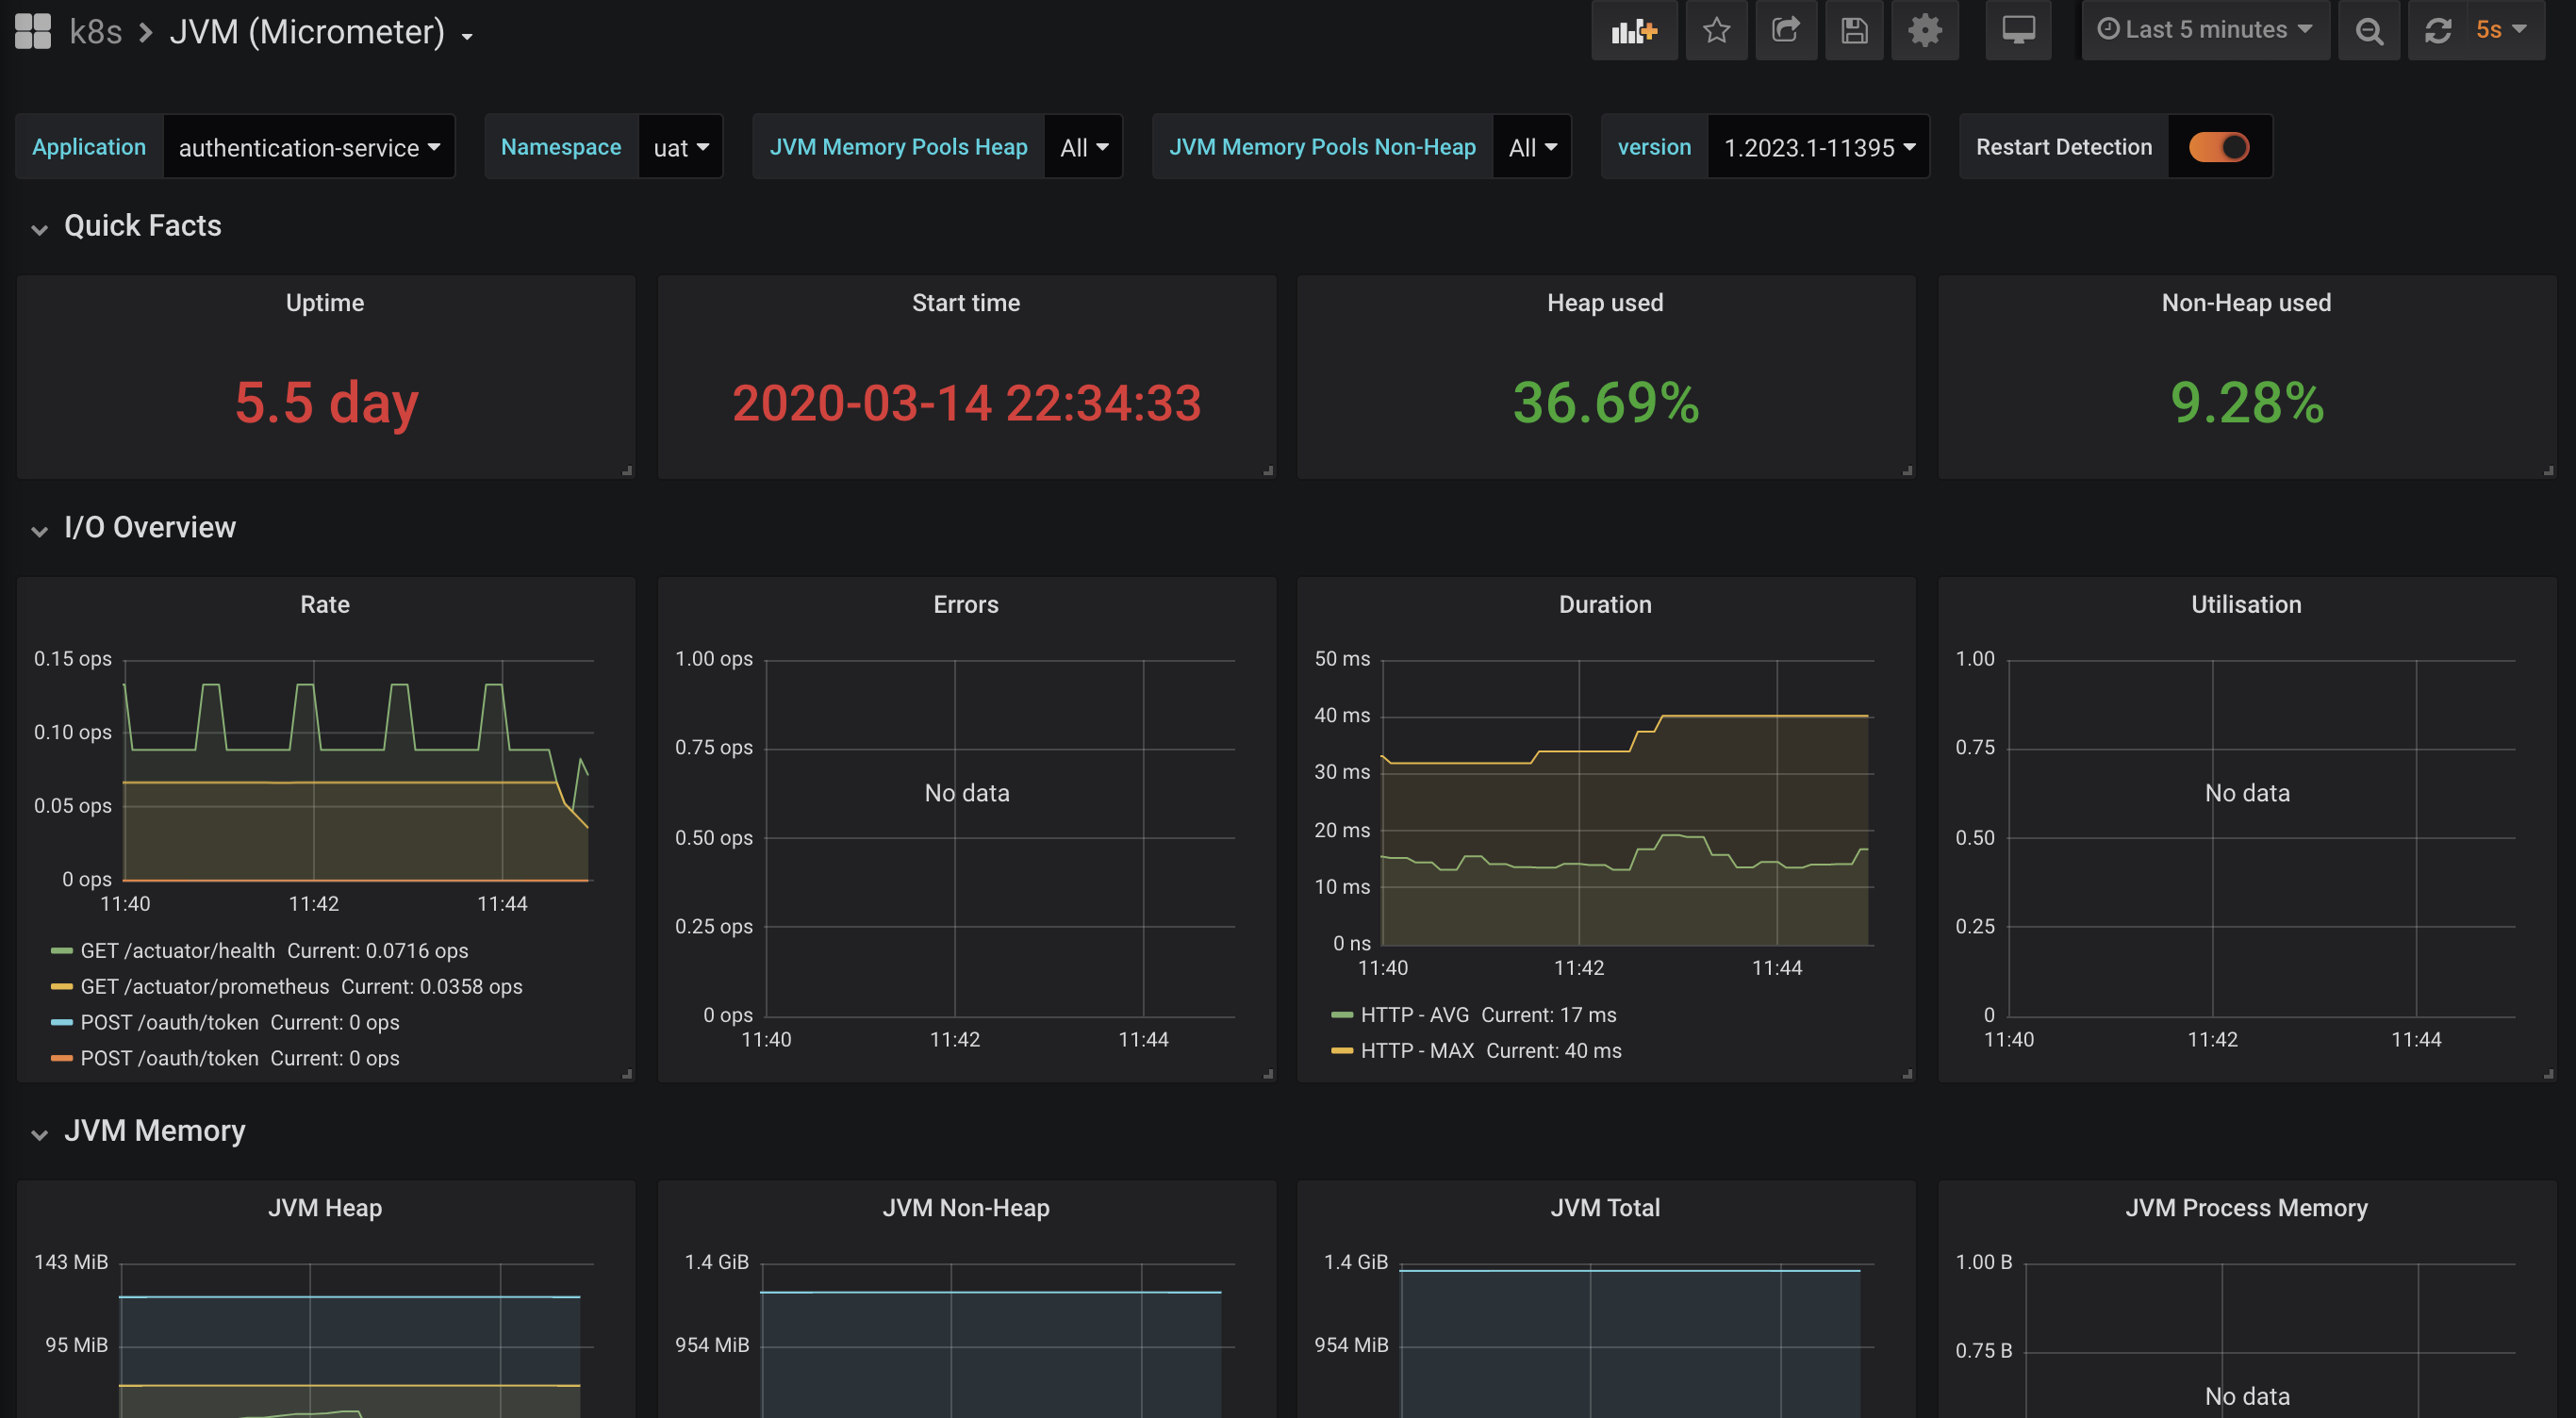
JVM (Micrometer)
A dashboard for Micrometer instrumented applications (Java, Spring Boot, Micronaut).
This dashboard config support for Prometheus which auto instal by istio service-mesh on Kubernetes.
Base on JVM (Micrometer)by mweirauch and add more support istio by me.
Contact
For suggestions or bug reports, please contact me on Twitter or my website.
Happy k8s :)
Used Metrics 3838
process_uptime_seconds
-
process_start_time_seconds
jvm_memory_used_bytes
jvm_memory_max_bytes
http_server_requests_seconds_count
http_server_requests_seconds_sum
http_server_requests_seconds_max
tomcat_threads_busy_threads
tomcat_threads_current_threads
tomcat_threads_config_max_threads
jetty_threads_busy
jetty_threads_current
jetty_threads_config_max
jvm_memory_committed_bytes
process_memory_vss_bytes
process_memory_rss_bytes
process_memory_swap_bytes
system_cpu_usage
process_cpu_usage
system_load_average_
system_cpu_count
jvm_threads_live_threads
jvm_threads_daemon_threads
jvm_threads_peak_threads
process_threads
jvm_threads_states_threads
logback_events_total
process_files_open_files
process_files_max_files
jvm_gc_pause_seconds_count
jvm_gc_pause_seconds_sum
jvm_gc_pause_seconds_max
jvm_gc_memory_allocated_bytes_total
jvm_gc_memory_promoted_bytes_total
jvm_classes_loaded_classes
jvm_buffer_memory_used_bytes
jvm_buffer_total_capacity_bytes
jvm_buffer_count_buffers