Prometheus Benchmark - 2.17.x 9,8909,890
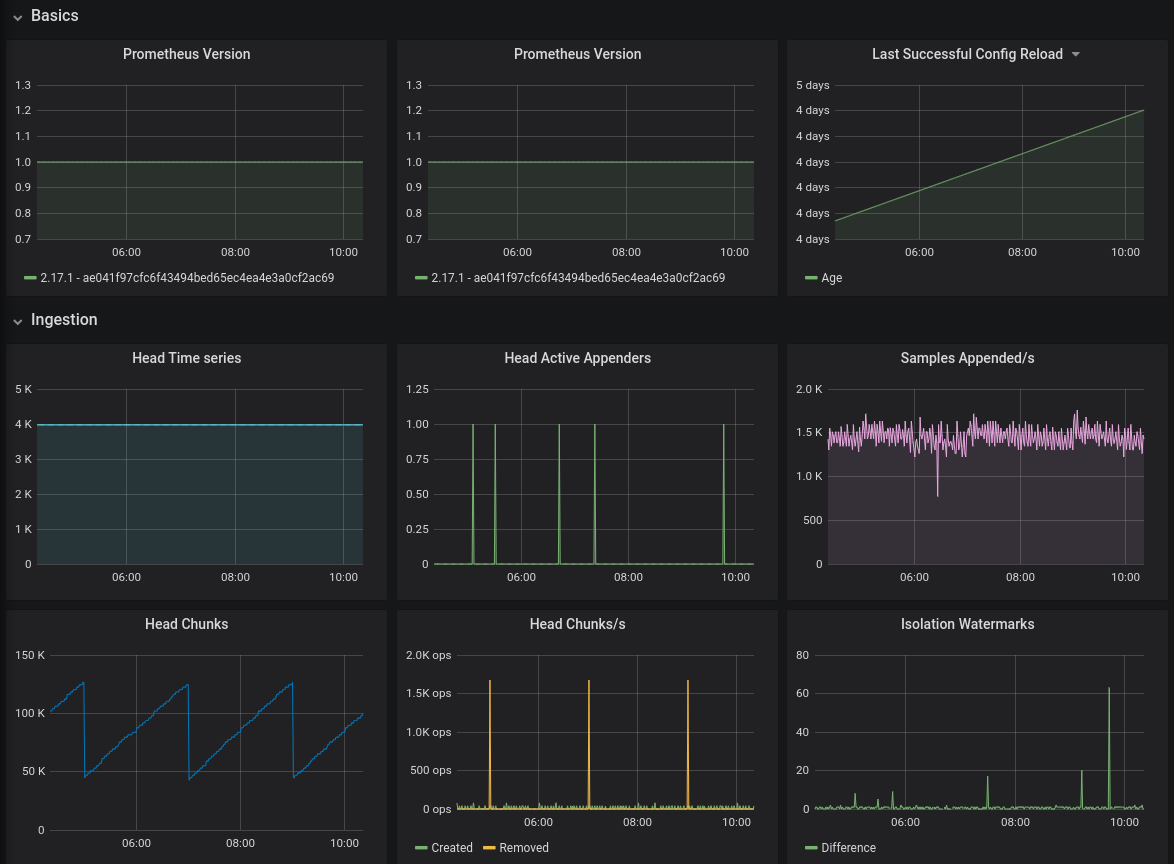
To use scrape the Prometheus (running on port 9090 with job label prometheus) on that machine every 1 second. This will provide key stats about Prometheus and machine performance.
Used Metrics 7474
-
prometheus_build_info
-
process_start_time_seconds
-
prometheus_config_last_reload_success_timestamp_seconds
-
prometheus_tsdb_head_series
-
prometheus_tsdb_head_active_appenders
-
prometheus_tsdb_head_samples_appended_total
-
prometheus_tsdb_head_chunks
-
prometheus_tsdb_head_chunks_created_total
-
prometheus_tsdb_head_chunks_removed_total
-
prometheus_tsdb_isolation_high_watermark
-
prometheus_tsdb_isolation_low_watermark
-
prometheus_tsdb_head_min_time
-
prometheus_tsdb_head_max_time
prometheus_tsdb_head_gc_duration_seconds_sum
-
prometheus_tsdb_blocks_loaded
-
prometheus_tsdb_reloads_total
prometheus_tsdb_wal_fsync_duration_seconds_sum
prometheus_tsdb_wal_fsync_duration_seconds_count
prometheus_tsdb_wal_truncate_duration_seconds_sum
prometheus_tsdb_wal_trunacte_duration_seconds_count
-
prometheus_tsdb_wal_corruptions_total
-
prometheus_tsdb_reloads_failures_total
prometheus_tsdb_head_series_not_found
-
prometheus_tsdb_compactions_failed_total
prometheus_tsdb_retention_cutoffs_failures_total
-
prometheus_tsdb_checkpoint_creations_failed_total
-
prometheus_tsdb_checkpoint_deletions_failed_total
-
prometheus_tsdb_compactions_total
prometheus_tsdb_compaction_duration_seconds_sum
-
prometheus_tsdb_time_retentions_total
-
prometheus_tsdb_size_retentions_total
prometheus_tsdb_compaction_chunk_range_seconds_sum
prometheus_tsdb_compaction_chunk_range_seconds_count
prometheus_tsdb_compaction_chunk_size_bytes_sum
prometheus_tsdb_compaction_chunk_samples_sum
prometheus_tsdb_compaction_chunk_samples_count
-
process_resident_memory_bytes
prometheus_local_storage_target_heap_size_bytes
-
go_memstats_next_gc_bytes
-
go_memstats_alloc_bytes
-
go_memstats_alloc_bytes_total
-
process_cpu_seconds_total
-
prometheus_tsdb_symbol_table_size_bytes
prometheus_tsdb_storage_blocks_bytes_total
-
prometheus_tsdb_storage_blocks_bytes
-
process_max_fds
-
process_open_fds
-
prometheus_sd_discovered_targets
-
prometheus_sd_updates_total
-
prometheus_sd_received_updates_total
prometheus_target_interval_length_seconds_sum
prometheus_target_interval_length_seconds_count
-
prometheus_target_scrapes_exceeded_sample_limit_total
-
prometheus_target_scrapes_sample_duplicate_timestamp_total
-
prometheus_target_scrapes_sample_out_of_bounds_total
-
prometheus_target_scrapes_sample_out_of_order_total
-
prometheus_target_metadata_cache_bytes
prometheus_engine_query_duration_seconds_sum
-
prometheus_rule_group_iterations_missed_total
-
prometheus_rule_evaluation_failures_total
prometheus_rule_group_duration_seconds_sum
-
prometheus_notifications_sent_total
-
prometheus_notifications_errors_total
prometheus_notifications_latency_seconds_sum
prometheus_notifications_latency_seconds_count
-
prometheus_notifications_alertmanagers_discovered
-
prometheus_notifications_dropped_total
-
prometheus_notifications_queue_length
-
prometheus_notifications_queue_capacity
prometheus_http_request_duration_seconds_count
prometheus_http_request_duration_seconds_sum
-
prometheus_rule_group_interval_seconds
-
prometheus_rule_group_last_duration_seconds
-
prometheus_rule_group_rules