Teku Overview 1,535,1801,535,180 5.0 (1 reviews)
4/29/2020
10/19/2023
1
>=6.2.4
Prometheus
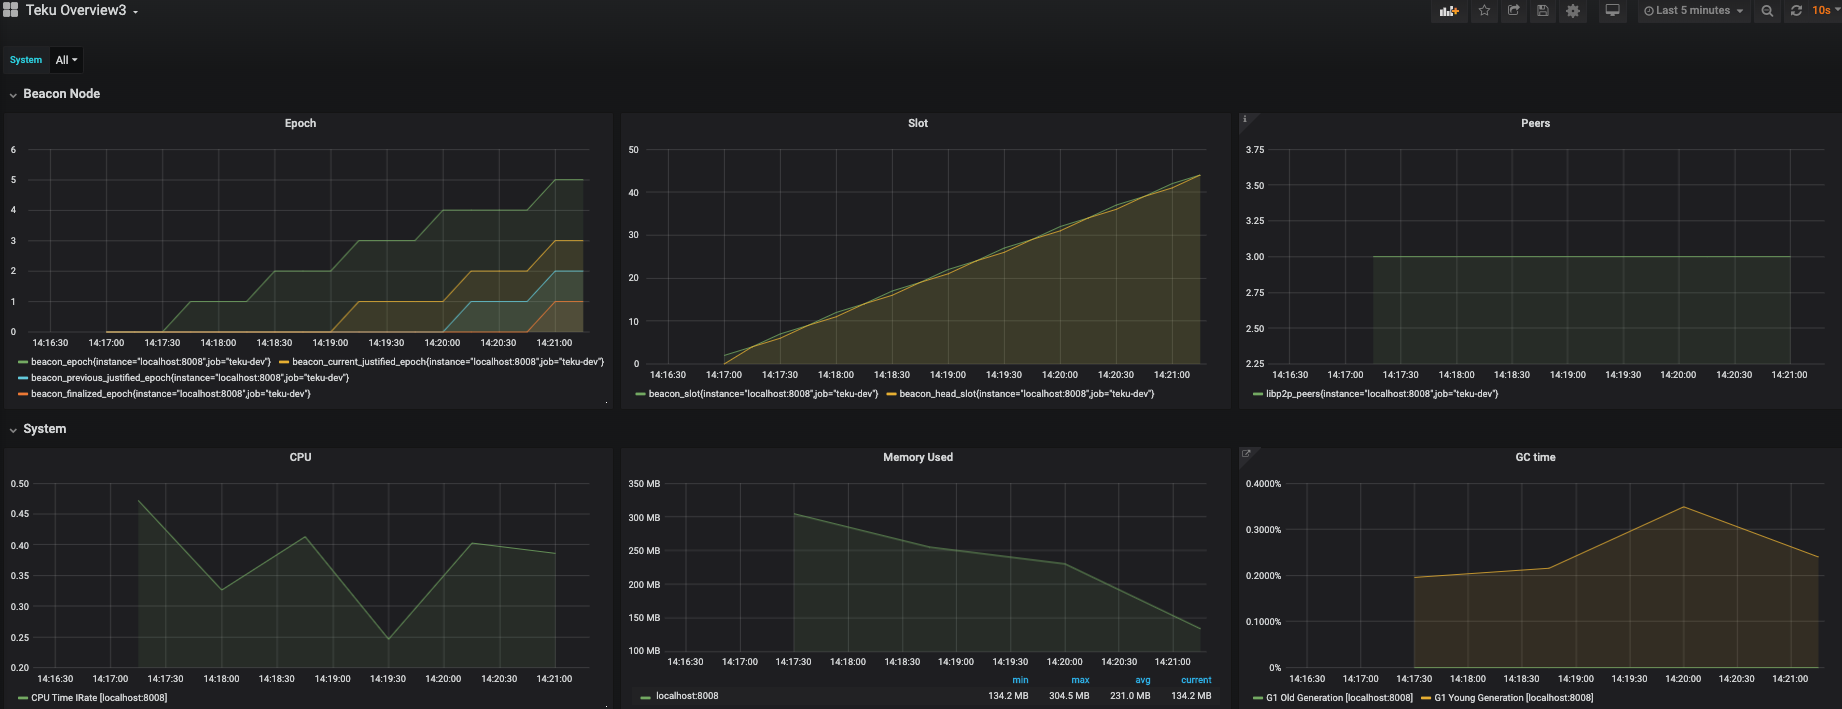
Teku Overview
Provides a dashboard for monitoring a Teku Ethereum 2 node. The required data is exported directly from Teku to a Prometheus data store. See the documentation on how to configure Teku and Prometheus.
The dashboard provides information on how well connected Teku is to the network, current, justified and finalized slot and epoch information, along with CPU and memory usage statistics.
Export Dashboard✕
Download
Copy to Clipboard
Used Metrics 1010
beacon_epoch
beacon_current_justified_epoch
beacon_previous_justified_epoch
beacon_finalized_epoch
beacon_slot
beacon_head_slot
libp2p_peers
-
process_cpu_seconds_total
jvm_memory_bytes_used
jvm_gc_collection_seconds_sum