NVIDIA DCGM Exporter Dashboard 28,706,99228,706,992 3.5 (8 reviews)
5/6/2020
9/23/2021
2
>=6.7.3
Prometheus
Introduction
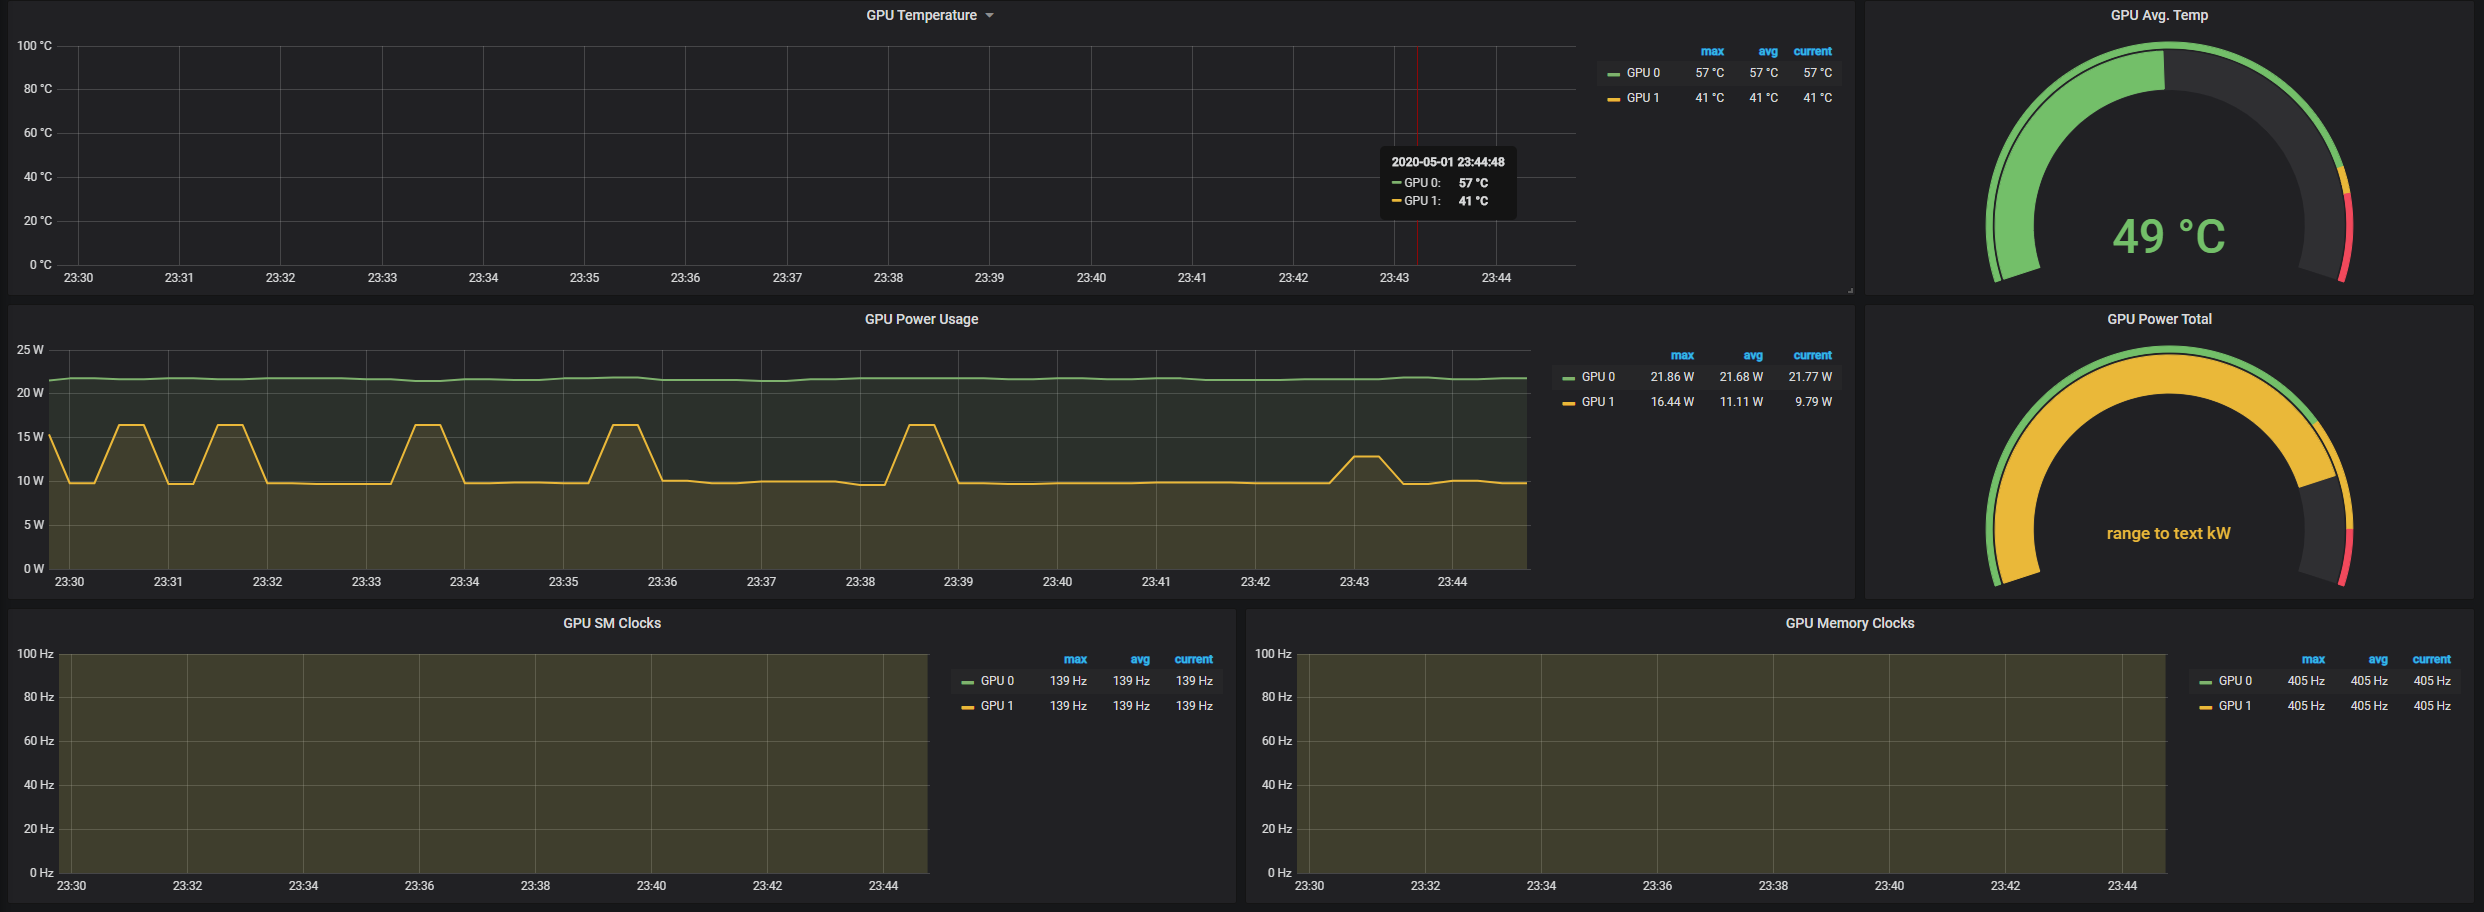
This dashboard displays GPU metrics collected from NVIDIA dcgm-exporter via a metric endpoint added to Prometheus. A separate endpoint is added to Prometheus via a Service Monitor.
Refer to the documentation on getting started with GPU metrics
Export Dashboard✕
Download
Copy to Clipboard
Used Metrics 77
DCGM_FI_DEV_GPU_TEMP
gpu
DCGM_FI_DEV_POWER_USAGE
DCGM_FI_DEV_SM_CLOCK
DCGM_FI_DEV_GPU_UTIL
DCGM_FI_DEV_FB_USED
DCGM_FI_PROF_PIPE_TENSOR_ACTIVE