Node Exporter from Agent Integration 117,140117,140
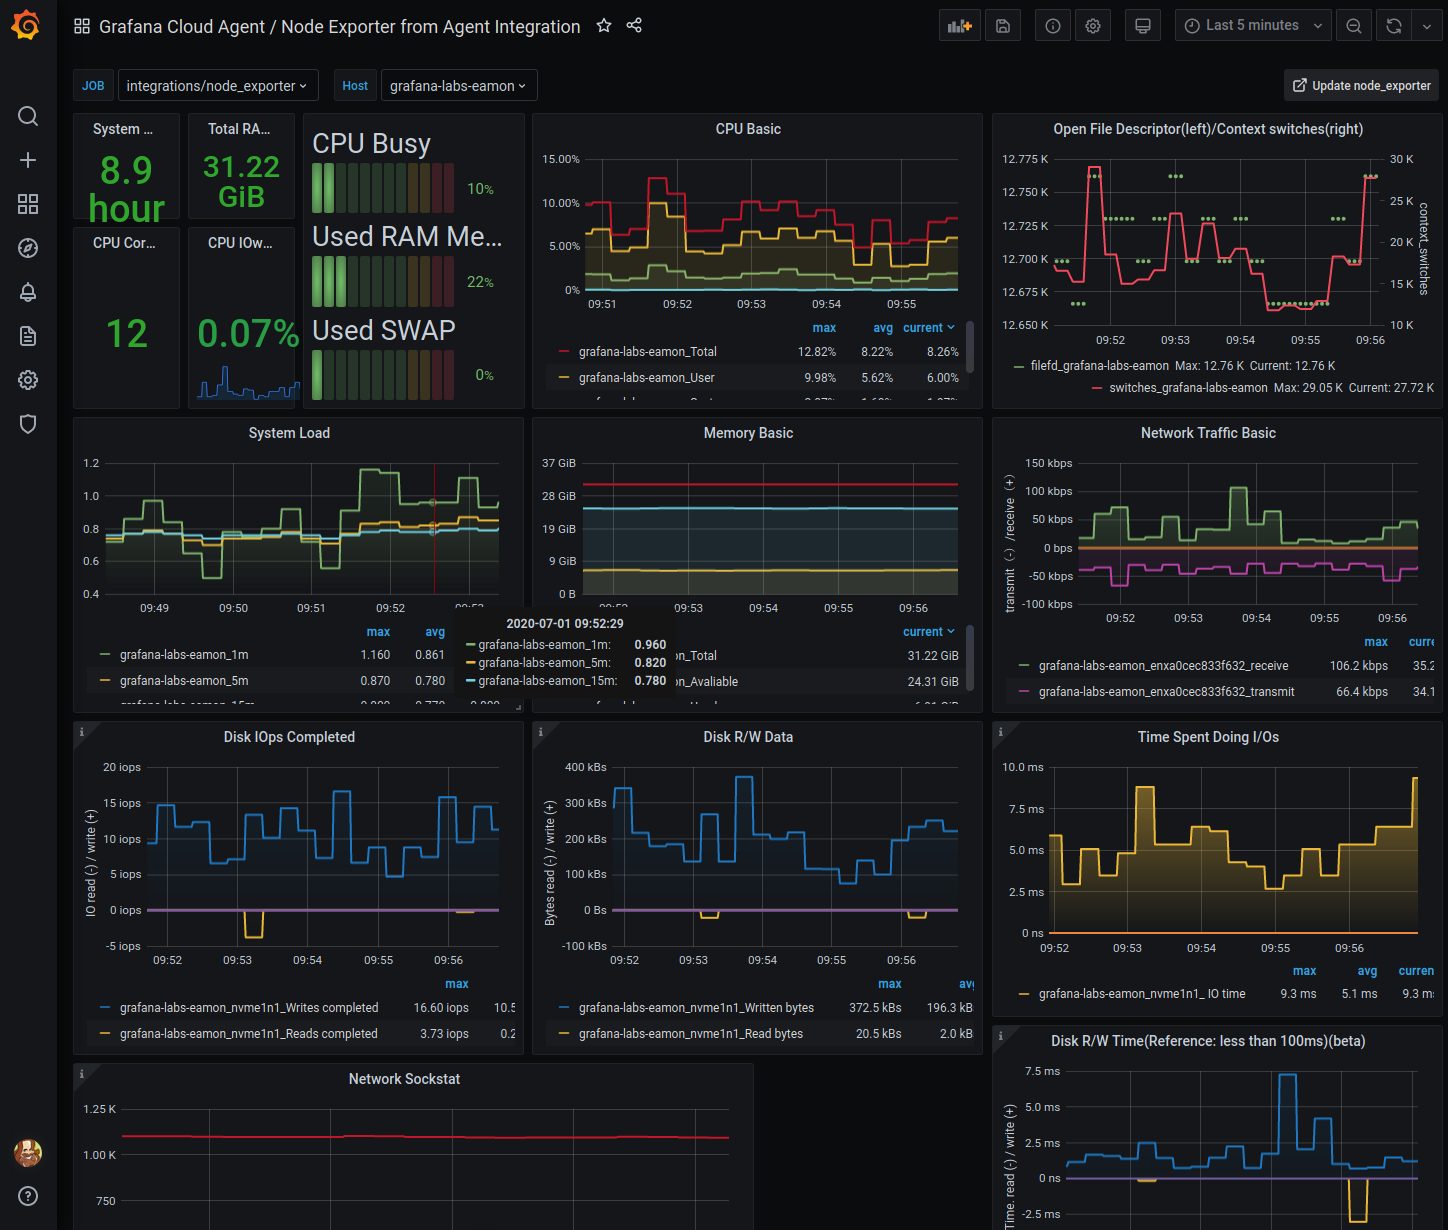
This dashboard will let you visualise node_exporter metrics as sent by the Grafana Cloud Agent - https://github.com/grafana/agent
Sample agent config file:
server:
  log_level: info
  http_listen_port: 12345
prometheus:
  wal_directory: /tmp/wal
  global:
    scrape_interval: 15s
integrations:
  agent:
    enabled: true
  node_exporter:
    enabled: true

  ## Remove the commented out section below and replace REMOTE_WRITE_URL,
  ## REMOTE_WRITE_USERNAME, and REMOTE_WRITE_PASSWORD with the appropriate
  ## values for your specific Grafana Cloud Prometheus instance.
  prometheus_remote_write:
   - url: https://prometheus-us-central1.grafana.net/api/prom/push
     basic_auth:
       username: <your-username>
password: <your-password>
Used Metrics 2929
-
node_boot_time_seconds
-
node_memory_MemTotal_bytes
-
node_cpu_seconds_total
-
node_memory_MemAvailable_bytes
-
node_filesystem_avail_bytes
-
node_filesystem_size_bytes
-
node_memory_SwapFree_bytes
-
node_memory_SwapTotal_bytes
-
node_filefd_allocated
-
node_context_switches_total
-
node_filefd_maximum
-
node_load1
-
node_load5
-
node_load15
-
node_network_receive_bytes_total
-
node_network_transmit_bytes_total
-
node_disk_reads_completed_total
-
node_disk_writes_completed_total
-
node_disk_read_bytes_total
-
node_disk_written_bytes_total
-
node_disk_io_time_seconds_total
-
node_disk_read_time_seconds_total
-
node_disk_write_time_seconds_total
-
node_netstat_Tcp_CurrEstab
-
node_sockstat_TCP_tw
-
node_sockstat_sockets_used
-
node_sockstat_UDP_inuse
-
node_sockstat_TCP_alloc
node_hwmon_temp_celsius