MinIO Object Storage 2,7442,744 3.0 (1 reviews)
7/1/2020
7/14/2020
5
AWS
>=6.2.5
Prometheus
MinIO server exposes metrics on /minio/prometheus/metrics endpoint. Use the the demo server at https://play.min.io:9000/minio/prometheus/metrics to see the full list of exposed metrics.
Example of configuration:
- job_name: minio
    metrics_path: /minio/prometheus/metrics
    scheme: http
    static_configs:
      - targets: ['127.0.0.1:9000']
More instructions to configure the collector, can be found here: How to monitor MinIO server with Prometheus
Export Dashboard✕
Download
Copy to Clipboard
Used Metrics 1919
-
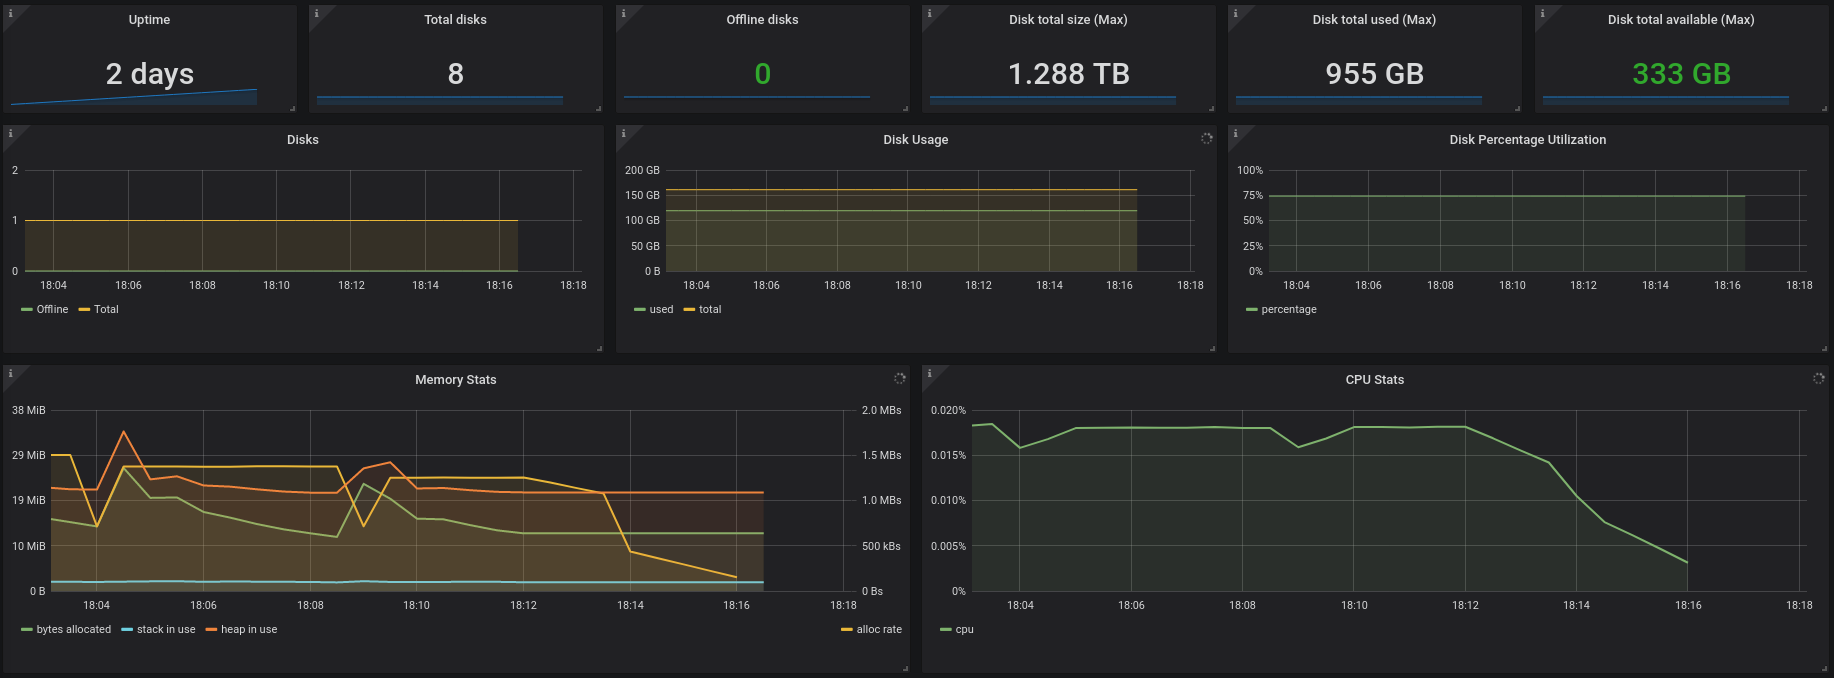
process_start_time_seconds
minio_disks_total
minio_disks_offline
disk_storage_total
disk_storage_used
disk_storage_available
-
process_resident_memory_bytes
-
process_virtual_memory_bytes
-
process_cpu_seconds_total
interval
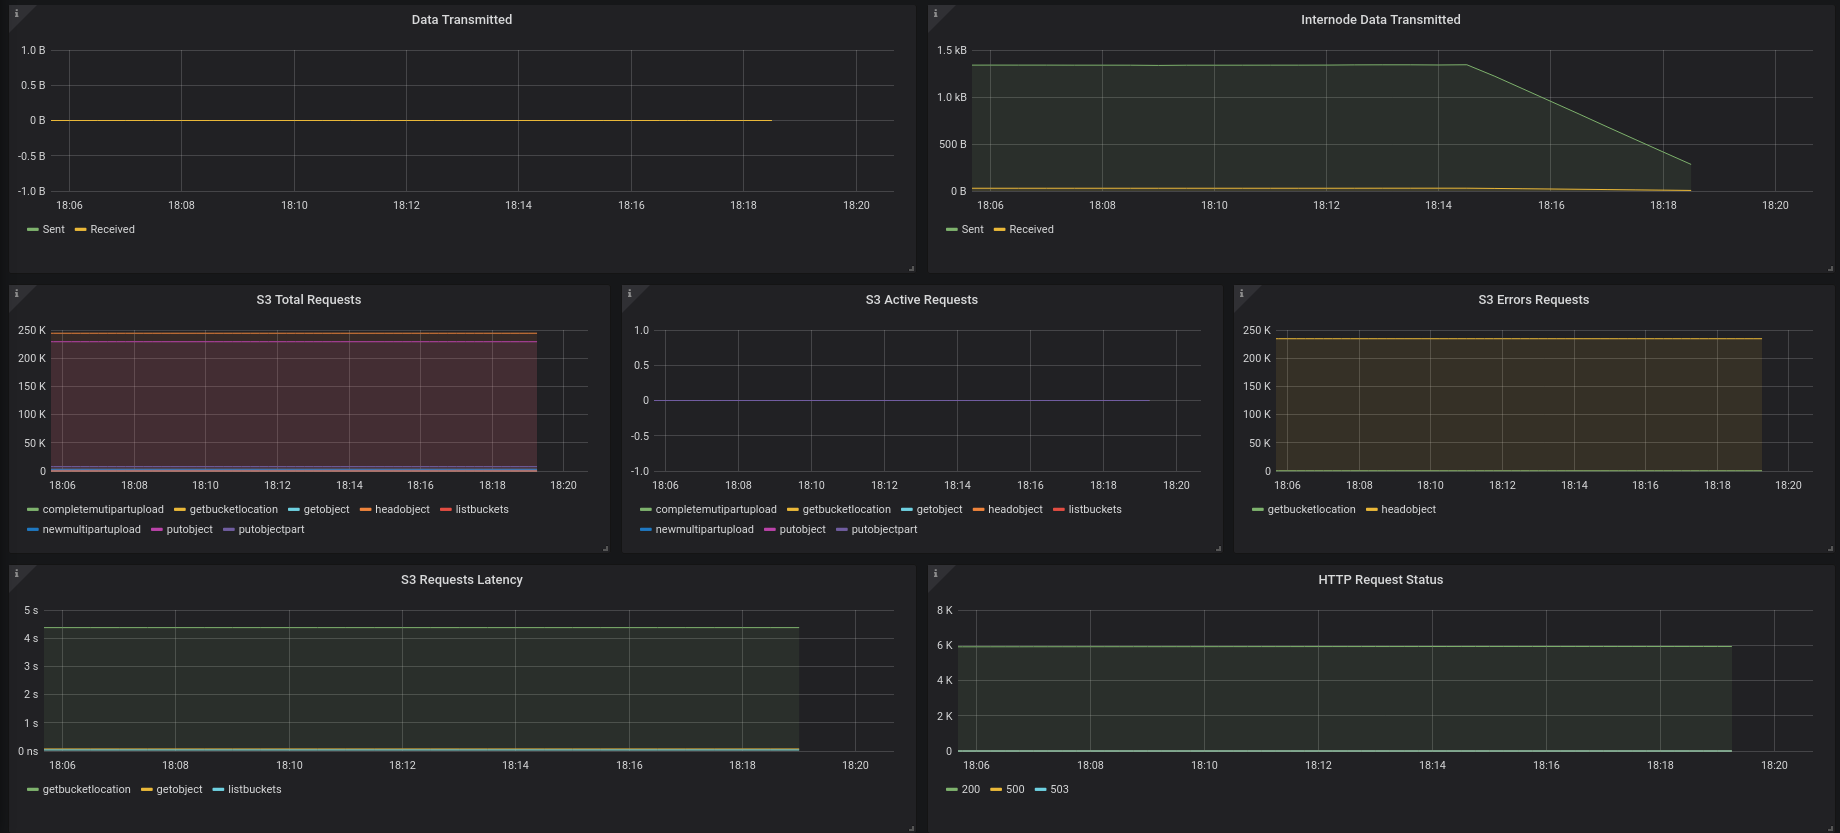
s3_tx_bytes_total
s3_rx_bytes_total
internode_tx_bytes_total
internode_rx_bytes_total
s3_requests_total
s3_requests_current
s3_errors_total
s3_ttfb_seconds_sum
-
promhttp_metric_handler_requests_total