1 SLS JVM监控大盘 3,8093,809 4.6 (9 reviews)
基于https://grafana.com/grafana/dashboards/4701 修改
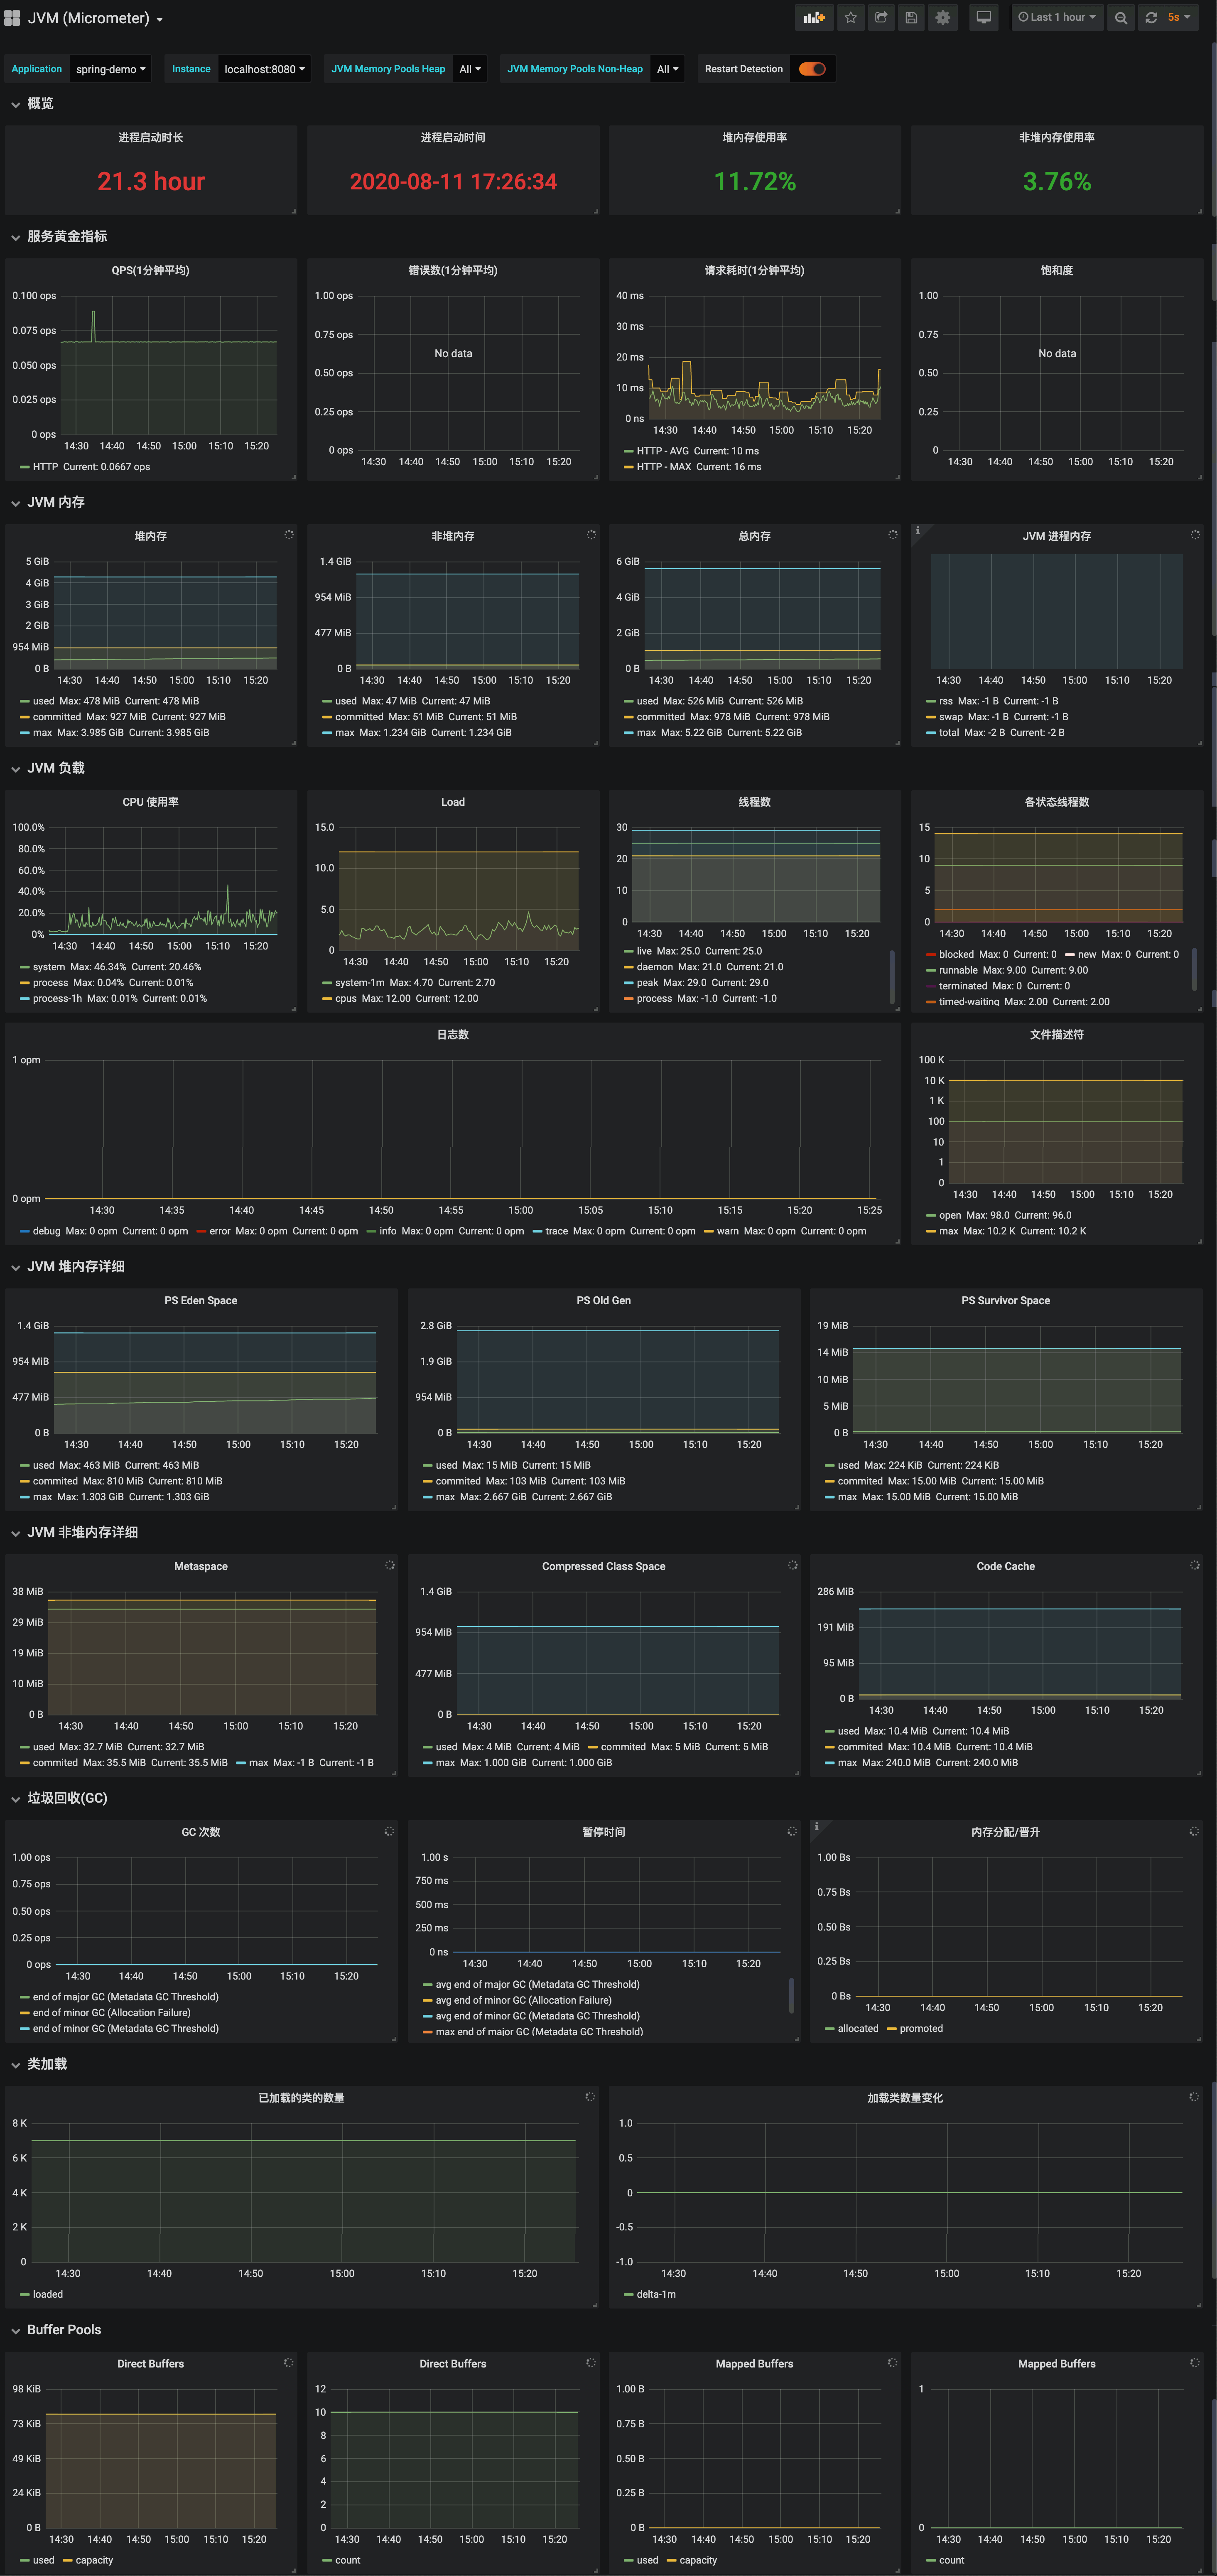
SLS JVM监控大盘
用于Spring Boot应用, 可采集JVM, Tomcat, 进程等监控指标 详细教程请查看: https://developer.aliyun.com/article/770726
配置步骤
- 在pom.xml中添加依赖:
<dependency>
      <groupId>org.springframework.boot</groupId>
      <artifactId>spring-boot-starter-actuator</artifactId>
 </dependency>
<dependency>
	<groupId>io.micrometer</groupId>
	<artifactId>micrometer-registry-prometheus</artifactId>
	<version>1.1.3</version>
</dependency>
<!-- 可选, 用于进程内存使用图表 -->
        <dependency>
            <groupId>io.github.mweirauch</groupId>
            <artifactId>micrometer-jvm-extras</artifactId>
            <version>0.2.0</version>
        </dependency>
- 修改spring boot配置(application.yml)
server:
  port: 8080
spring:
  application:
    name: spring-demo
management:
  endpoints:
    web:
      exposure:
        include: 'prometheus' # 暴露/actuator/prometheus
  metrics:
    tags:
      application: ${spring.application.name} # 暴露的数据中添加application label
- 在Prometheus中增加采集
global:
  scrape_interval: 15s
scrape_configs:
  - job_name: "spring-demo"
    metrics_path: "/actuator/prometheus"
    static_configs:
    - targets: ["localhost:8080"]
- 通过remote write 写入SLS的时序存储
https://help.aliyun.com/document_detail/171781.html
- Grafana中添加数据源
https://help.aliyun.com/document_detail/173903.html
CHANGELOG:
v0.1(2020-08-19): initial upload

Used Metrics 3838
process_uptime_seconds
-
process_start_time_seconds
jvm_memory_used_bytes
jvm_memory_max_bytes
http_server_requests_seconds_count
http_server_requests_seconds_sum
http_server_requests_seconds_max
tomcat_threads_busy_threads
tomcat_threads_current_threads
tomcat_threads_config_max_threads
jetty_threads_busy
jetty_threads_current
jetty_threads_config_max
jvm_memory_committed_bytes
process_memory_vss_bytes
process_memory_rss_bytes
process_memory_swap_bytes
system_cpu_usage
process_cpu_usage
system_load_average_
system_cpu_count
jvm_threads_live_threads
jvm_threads_daemon_threads
jvm_threads_peak_threads
process_threads
jvm_threads_states_threads
logback_events_total
process_files_open_files
process_files_max_files
jvm_gc_pause_seconds_count
jvm_gc_pause_seconds_sum
jvm_gc_pause_seconds_max
jvm_gc_memory_allocated_bytes_total
jvm_gc_memory_promoted_bytes_total
jvm_classes_loaded_classes
jvm_buffer_memory_used_bytes
jvm_buffer_total_capacity_bytes
jvm_buffer_count_buffers