WSO2 Integration Node Metrics 1,5641,564
8/25/2020
11/19/2025
3
Web Servers
PrometheusLoki
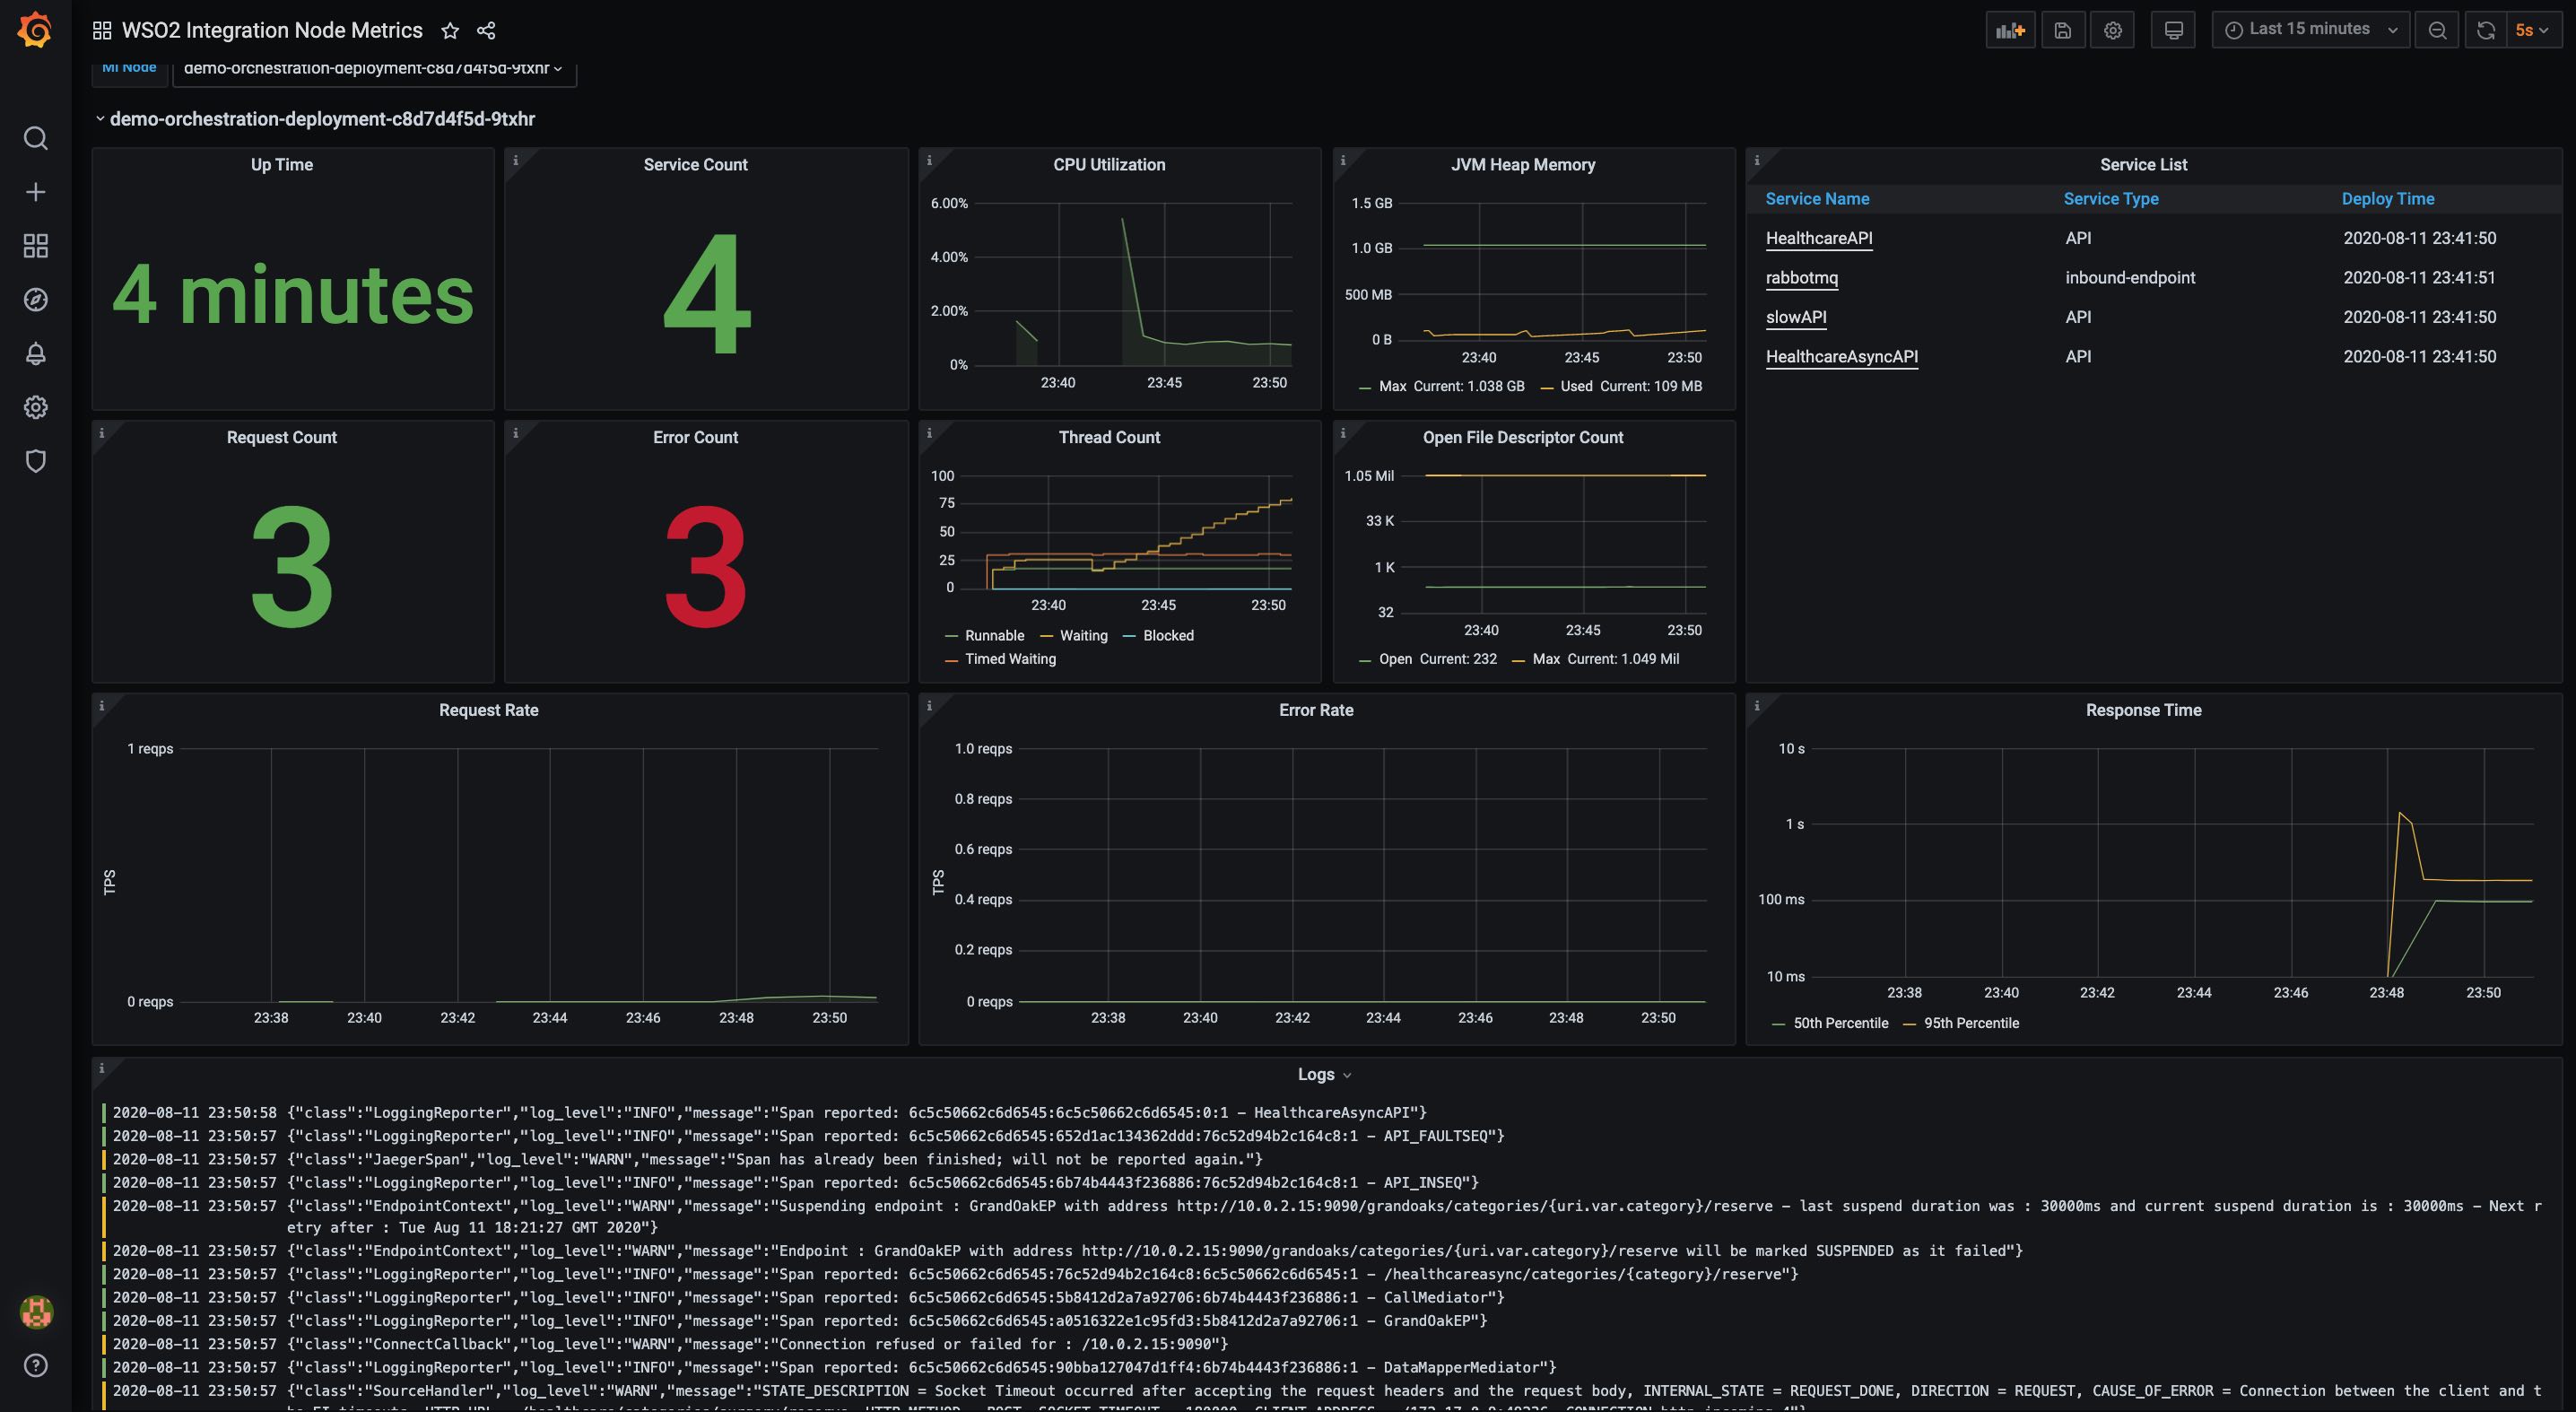
This Dashboard provides an overview of WSO2 integration nodes. From the selector users can selects the desired nodes they want to monitor and separate dynamic panels will be generated for each node. Dashboard will display following details about the nodes.
- Up Time
- Service Count
- Service List
- Request Count
- Error Count
- Request Rate
- Error Rate
- Response Time
- CPU Utilization of JVM
- JVM Heap Memory
- JVM Thread Count
- Open File Descriptor Count
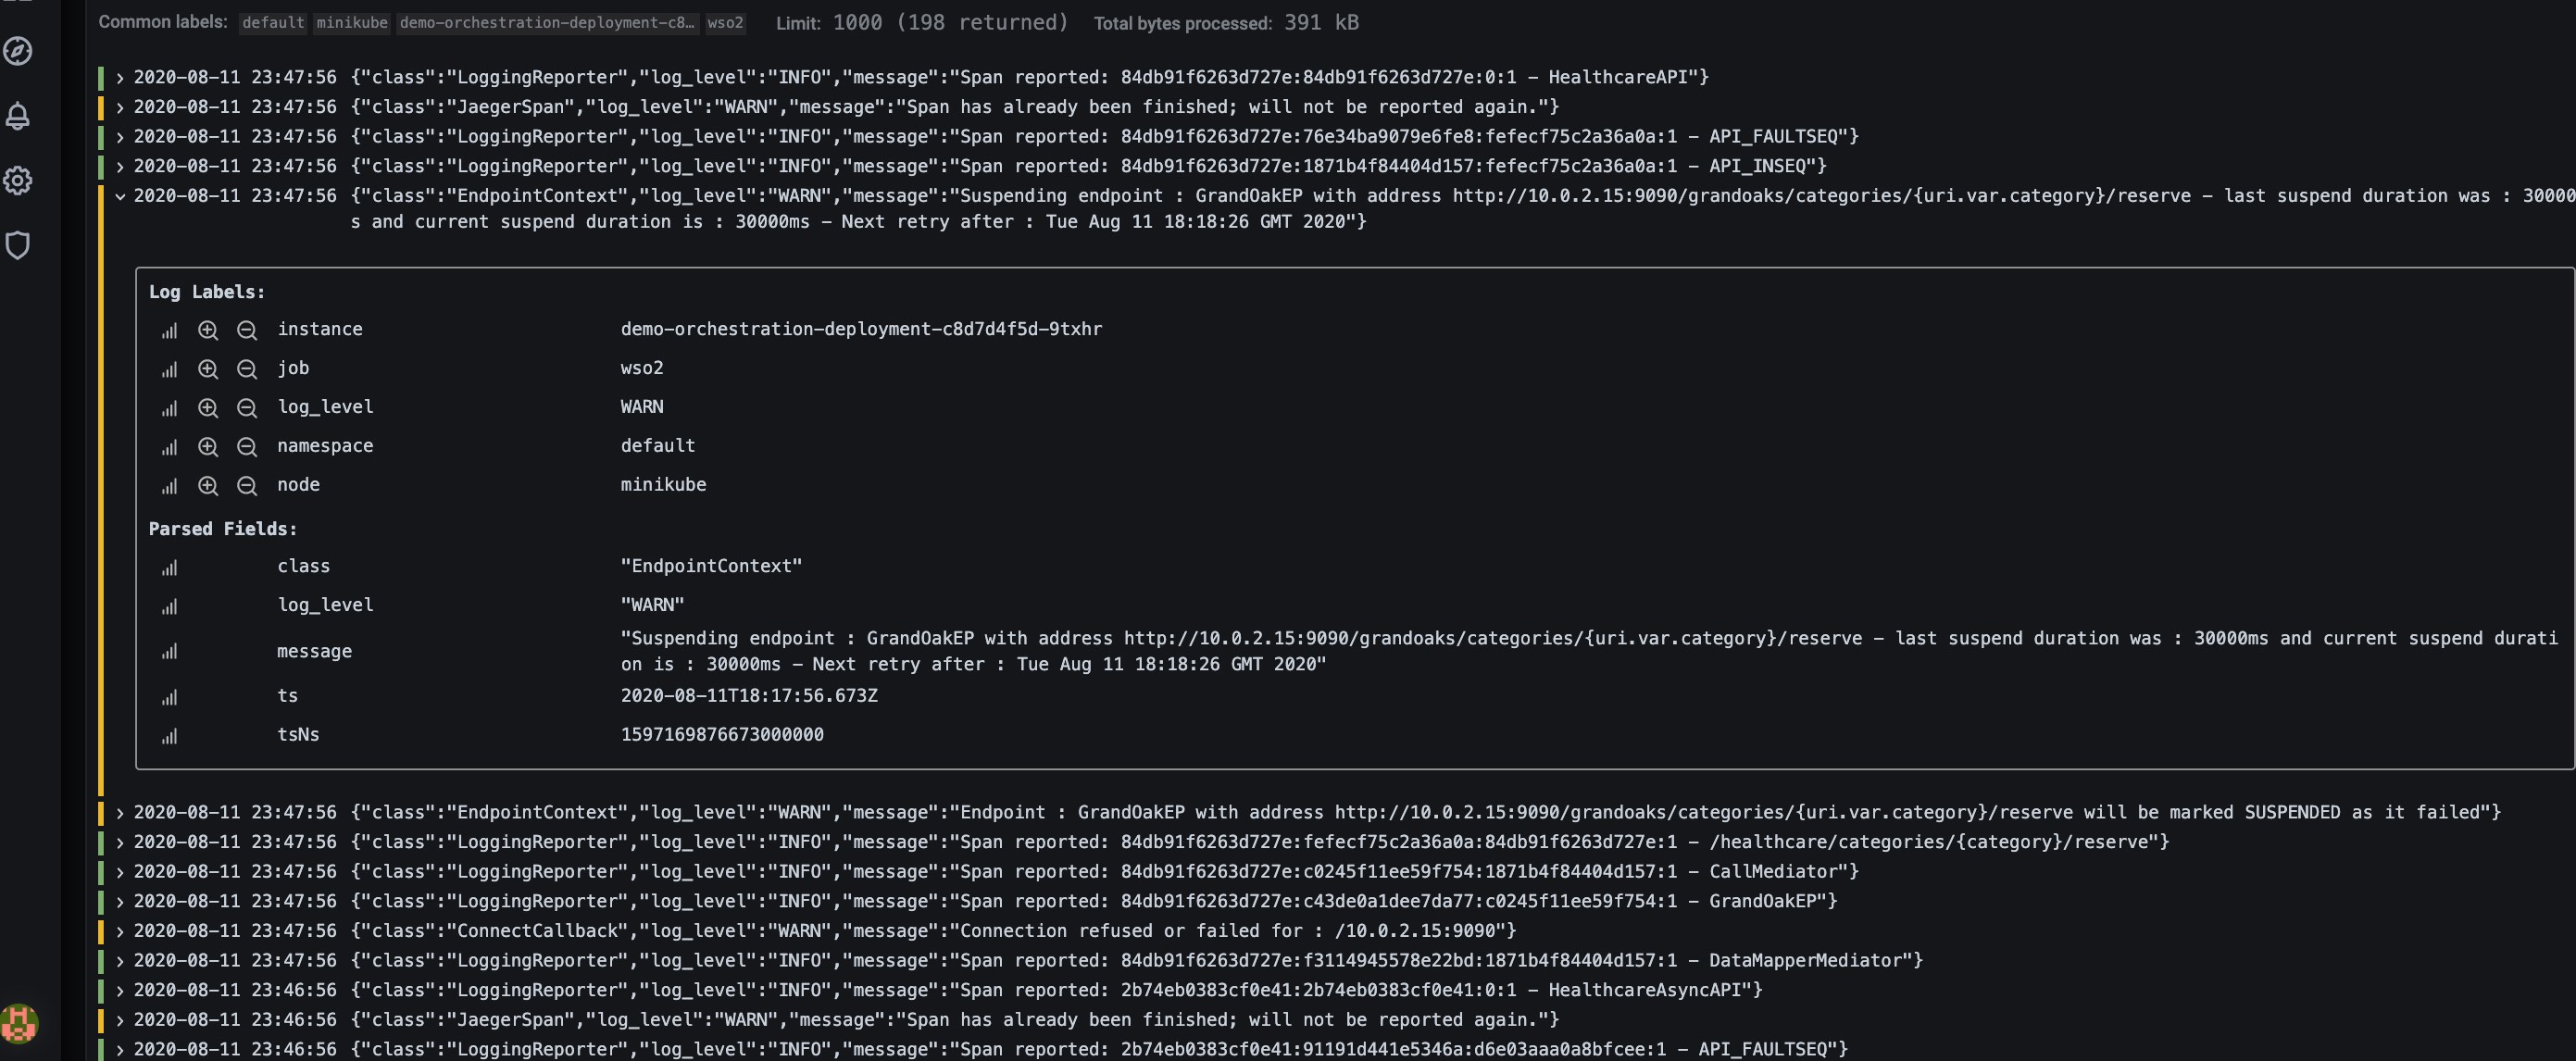
- Logs
Export Dashboard✕
Download
Copy to Clipboard
Used Metrics 88
wso2_integration_server_up
wso2_integration_service_up
-
process_cpu_seconds_total
jvm_memory_max_bytes
jvm_memory_used_bytes
jvm_threads_state
-
process_open_fds
-
process_max_fds