Hashicorp Vault 2,877,3942,877,394 4.0 (2 reviews)
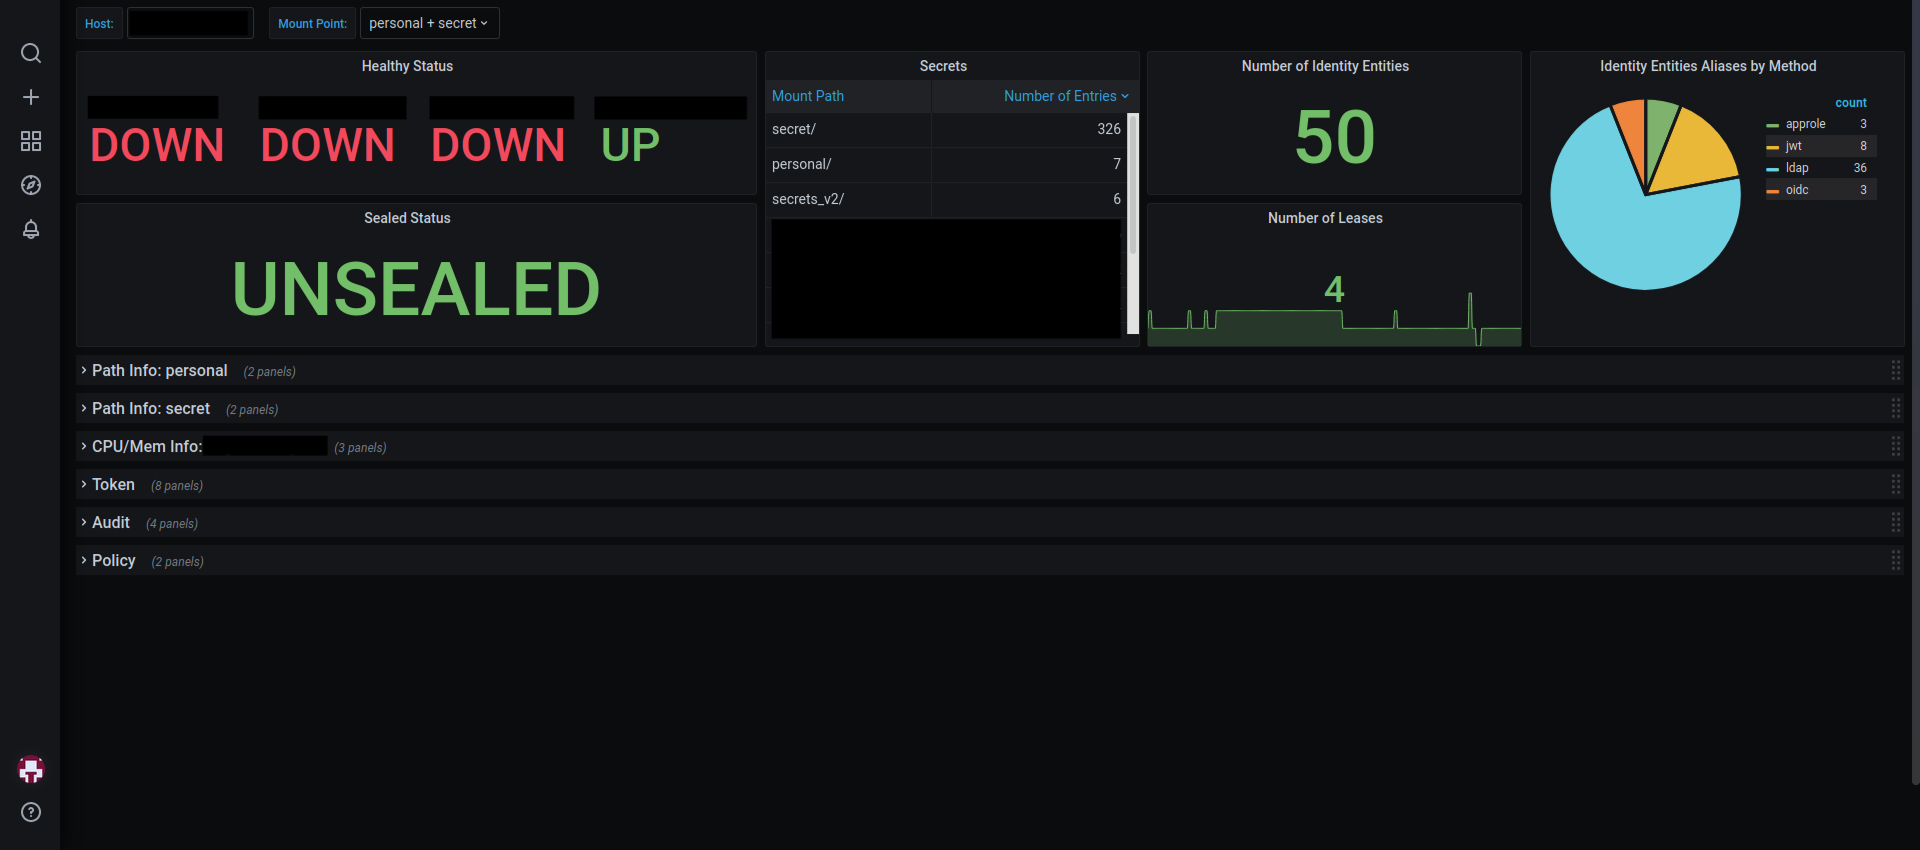
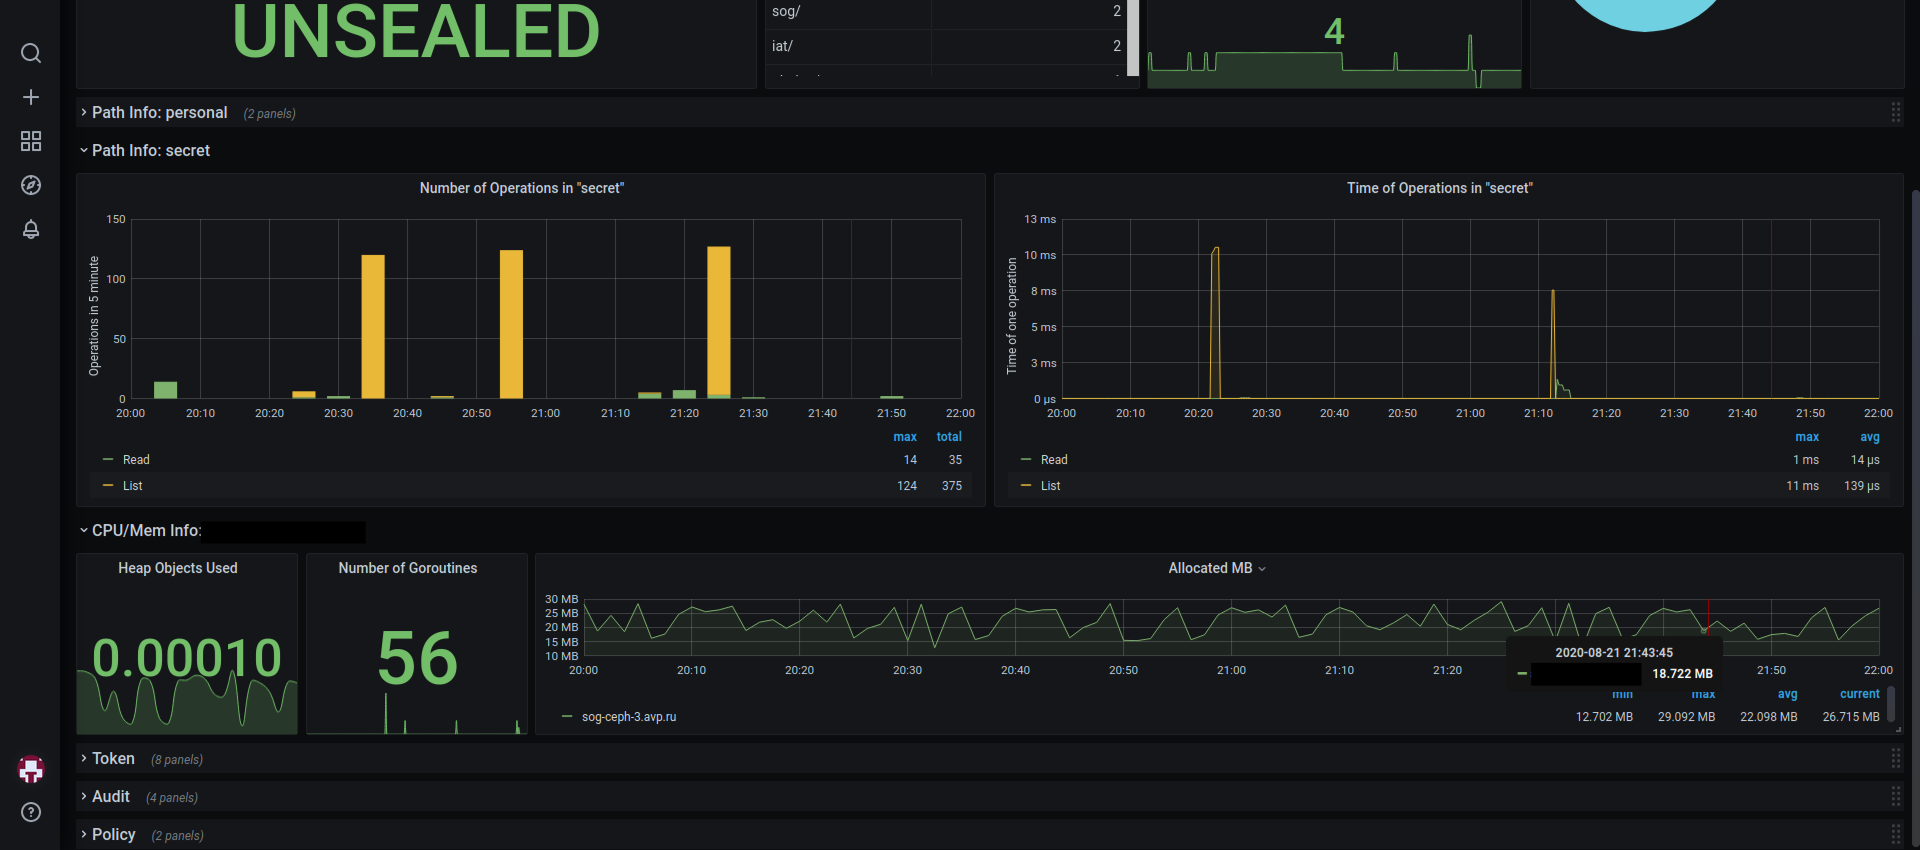
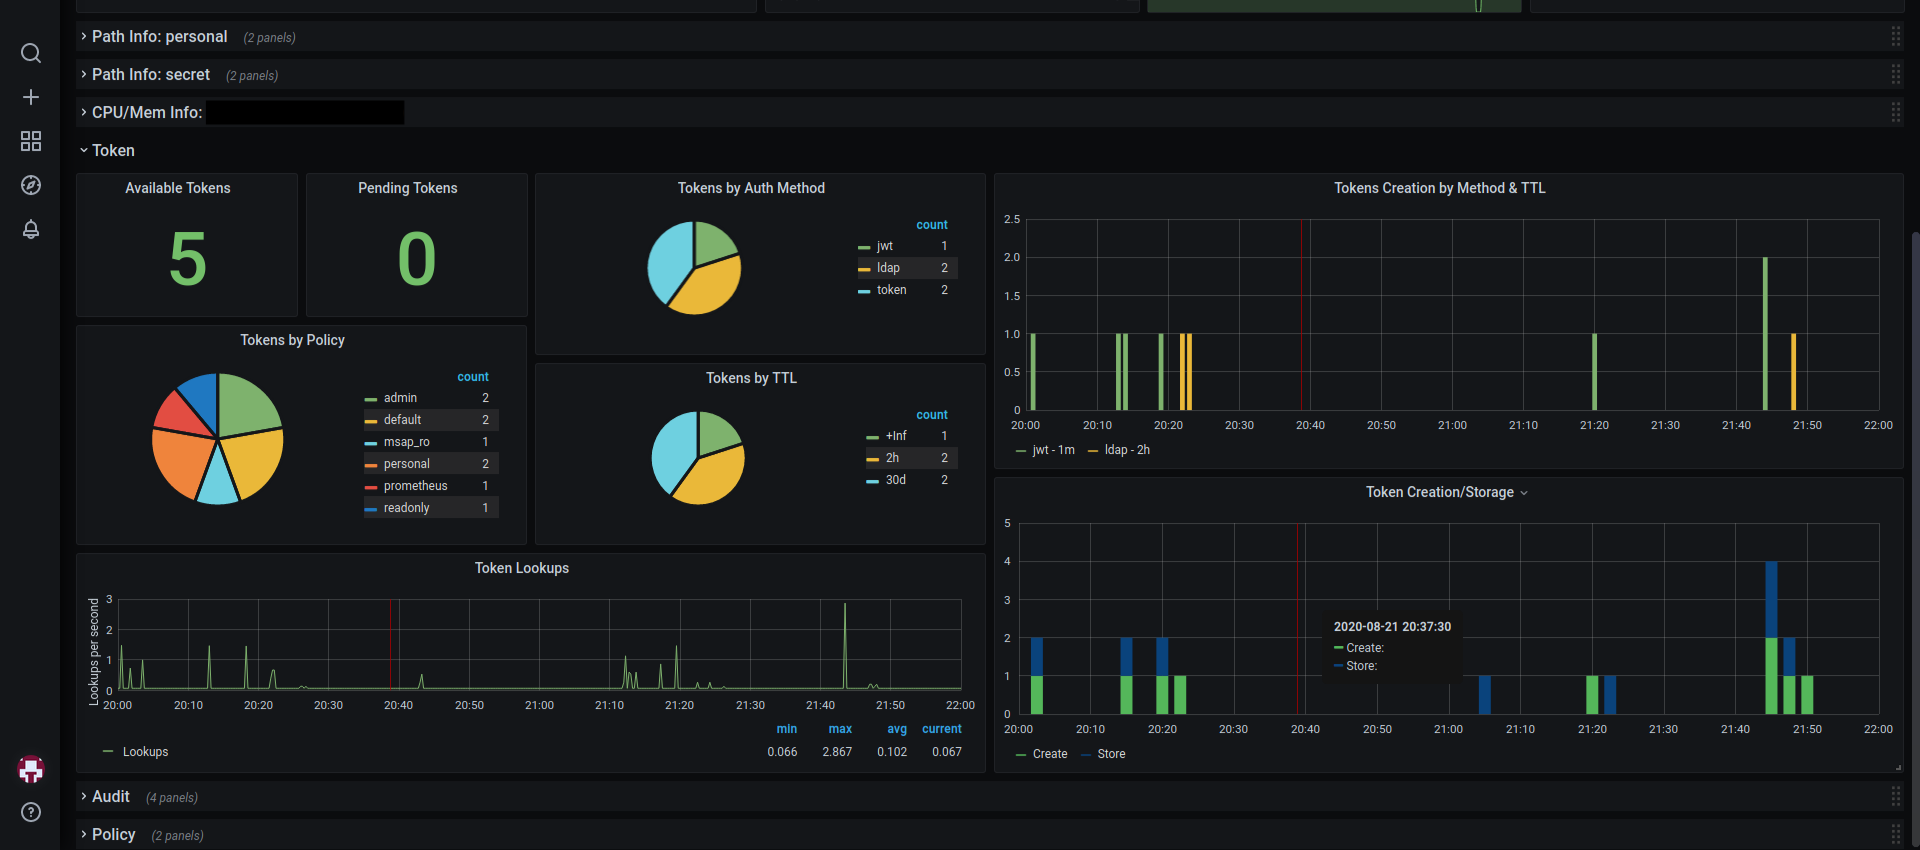
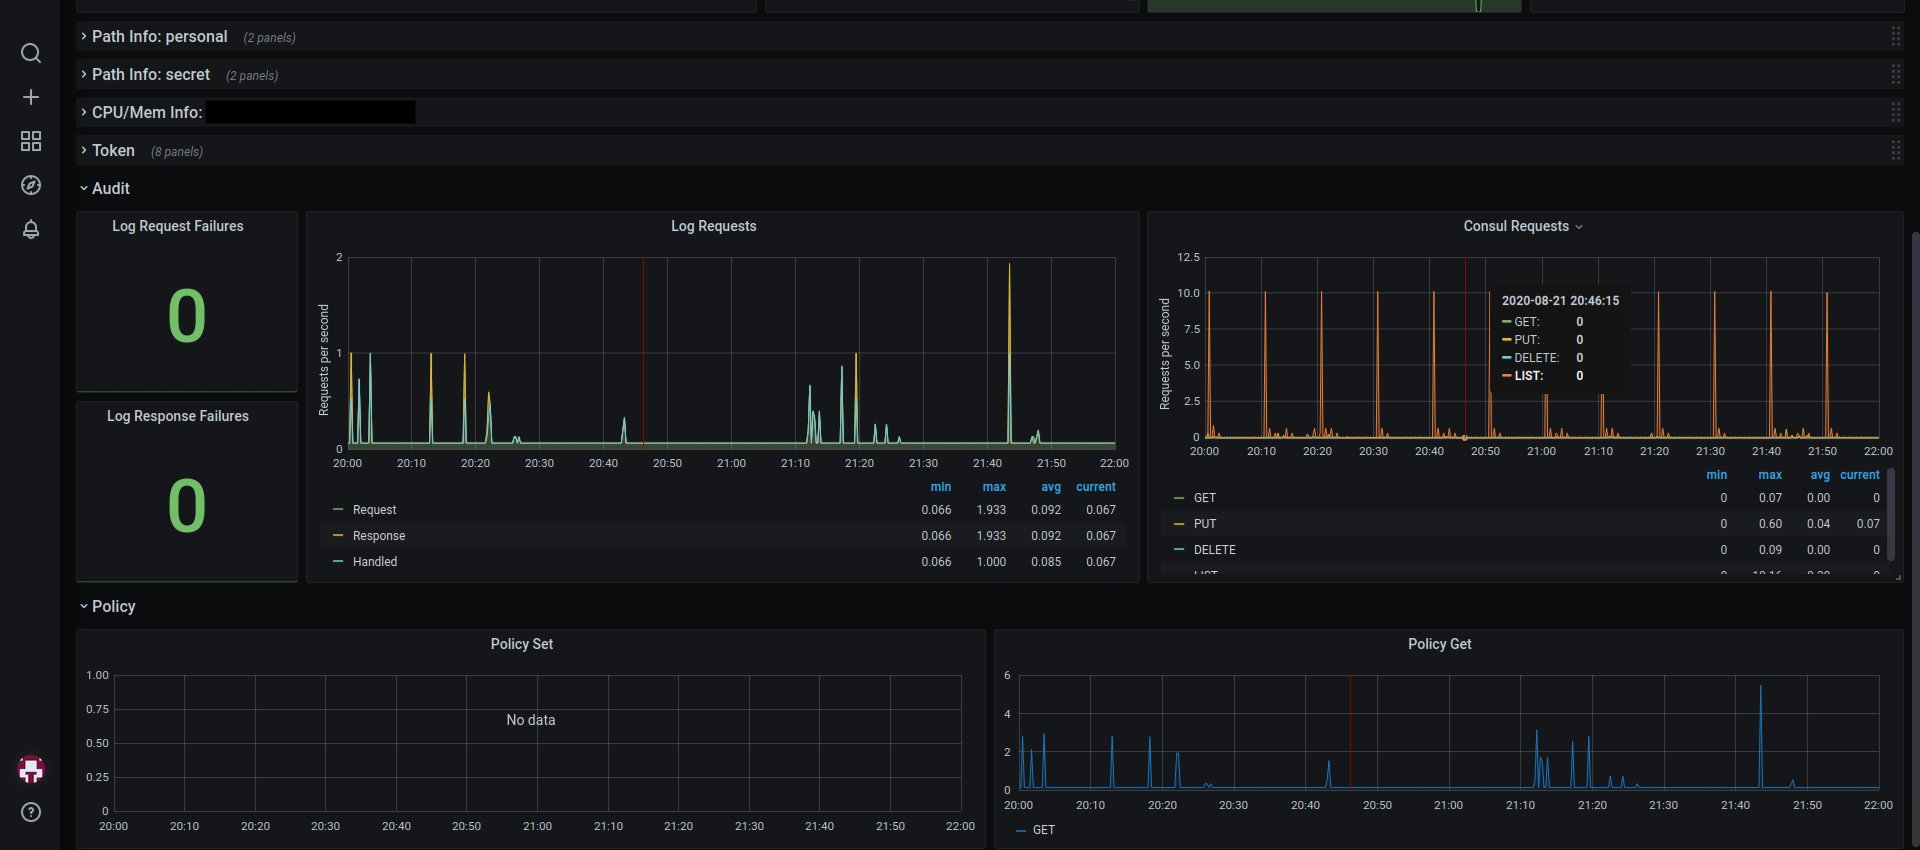
Dashboard contains:
- number of secrets in kv storages
- operations in kv storages
- number of tokens by different types
- operations with tokens
- memory usage by Vault
- requests to Vault
Version2:
- Changed pie-charts on bar-graphs for easier visual use
- Updated some labels
- Updated alerts
- Removed 'instance' variable as unnecessary
Download the first version to get a dashboard like in the pictures.

Used Metrics 2929
-
up
vault_secret_kv_count
vault_identity_num_entities
vault_identity_entity_alias_count
vault_core_unsealed
vault_expire_num_leases
vault_runtime_heap_objects
vault_runtime_malloc_count
vault_runtime_num_goroutines
vault_runtime_alloc_bytes
vault_token_count
vault_token_count_by_policy
vault_token_create_count
vault_token_store_count
vault_token_count_by_ttl
vault_token_count_by_auth
vault_token_creation
vault_token_lookup_count
vault_audit_log_request_failure
vault_audit_log_request_count
vault_audit_log_response_count
vault_core_handle_request_count
vault_consul_get_count
vault_consul_put_count
vault_consul_delete_count
vault_consul_list_count
vault_audit_log_response_failure
vault_policy_set_policy_count
vault_policy_get_policy_count


