System Metrics for the Linux Hosts 2,0742,074 5.0 (9 reviews)
9/16/2020
5/12/2022
2
Host Metrics
>=7.1.1
Prometheus
Installation:
You can download the binaries directly from the downloads page https://www.influxdata.com/downloads.
Ubuntu & Debian
wget https://dl.influxdata.com/telegraf/releases/telegraf_1.15.3-1_amd64.deb && dpkg -i telegraf_1.15.3-1_amd64.deb
RedHat & CentOS
wget https://dl.influxdata.com/telegraf/releases/telegraf-1.15.3-1.x86_64.rpm && yum localinstall telegraf-1.15.3-1.x86_64.rpm
Export Dashboard✕
Download
Copy to Clipboard
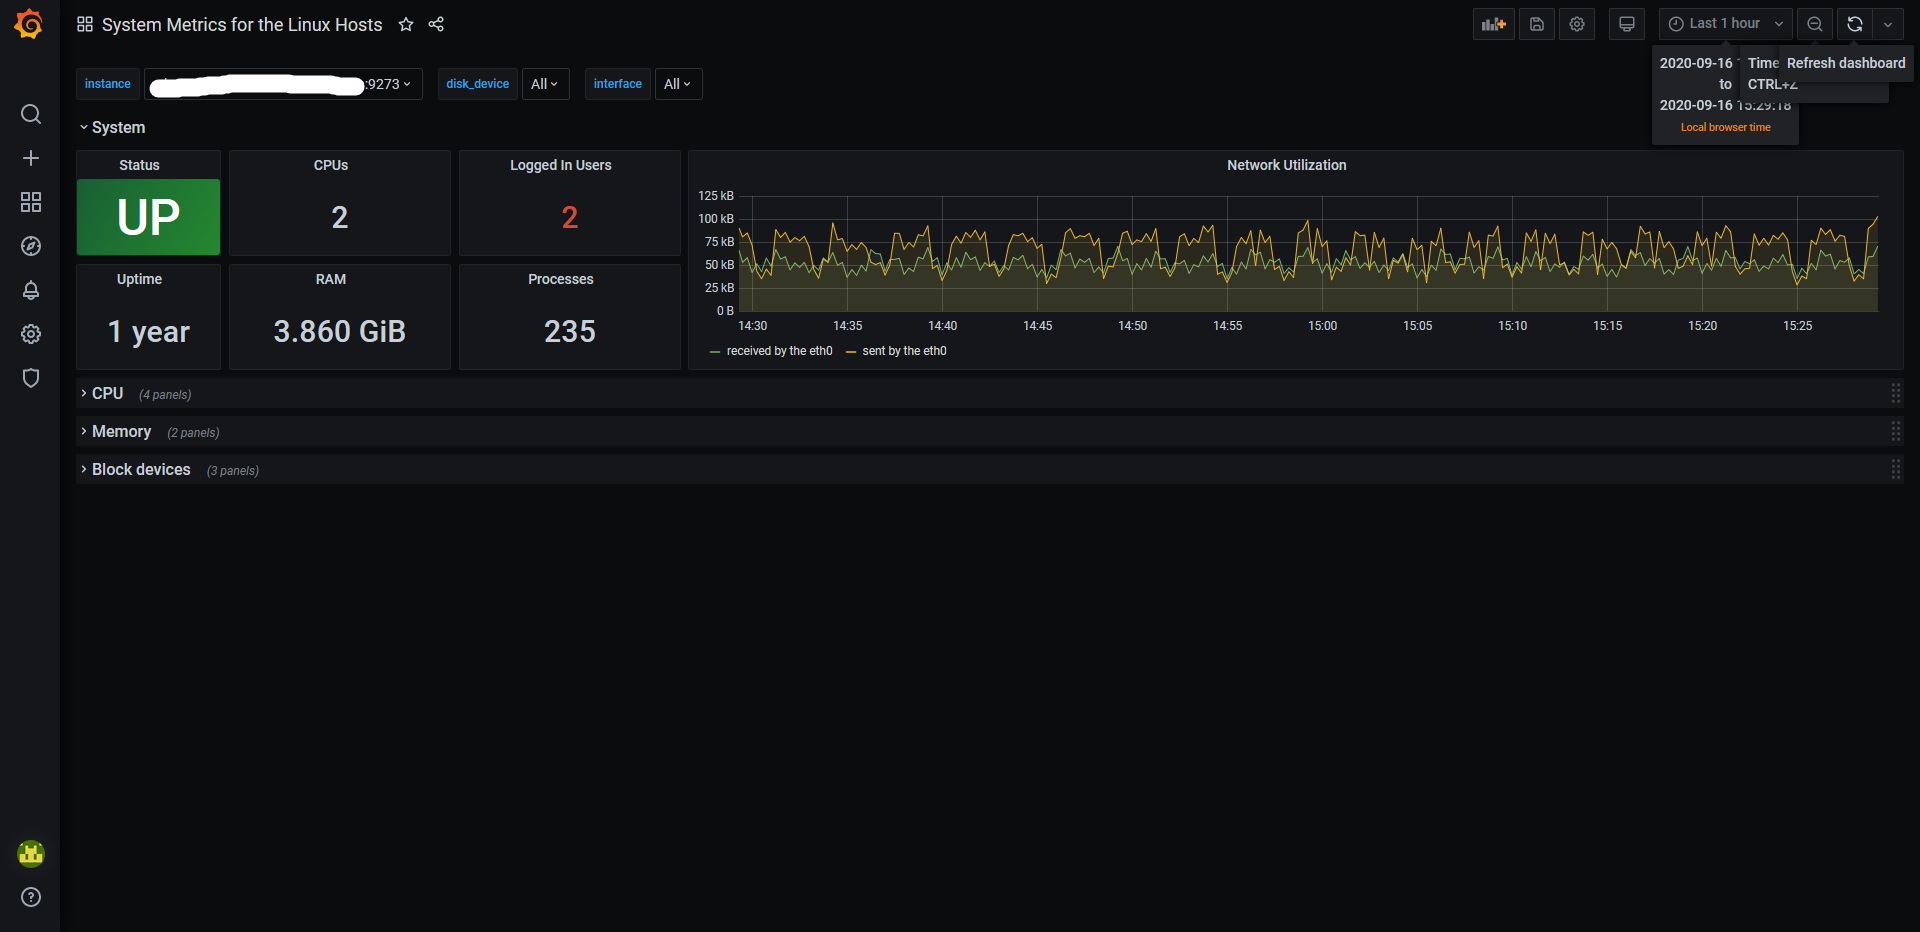
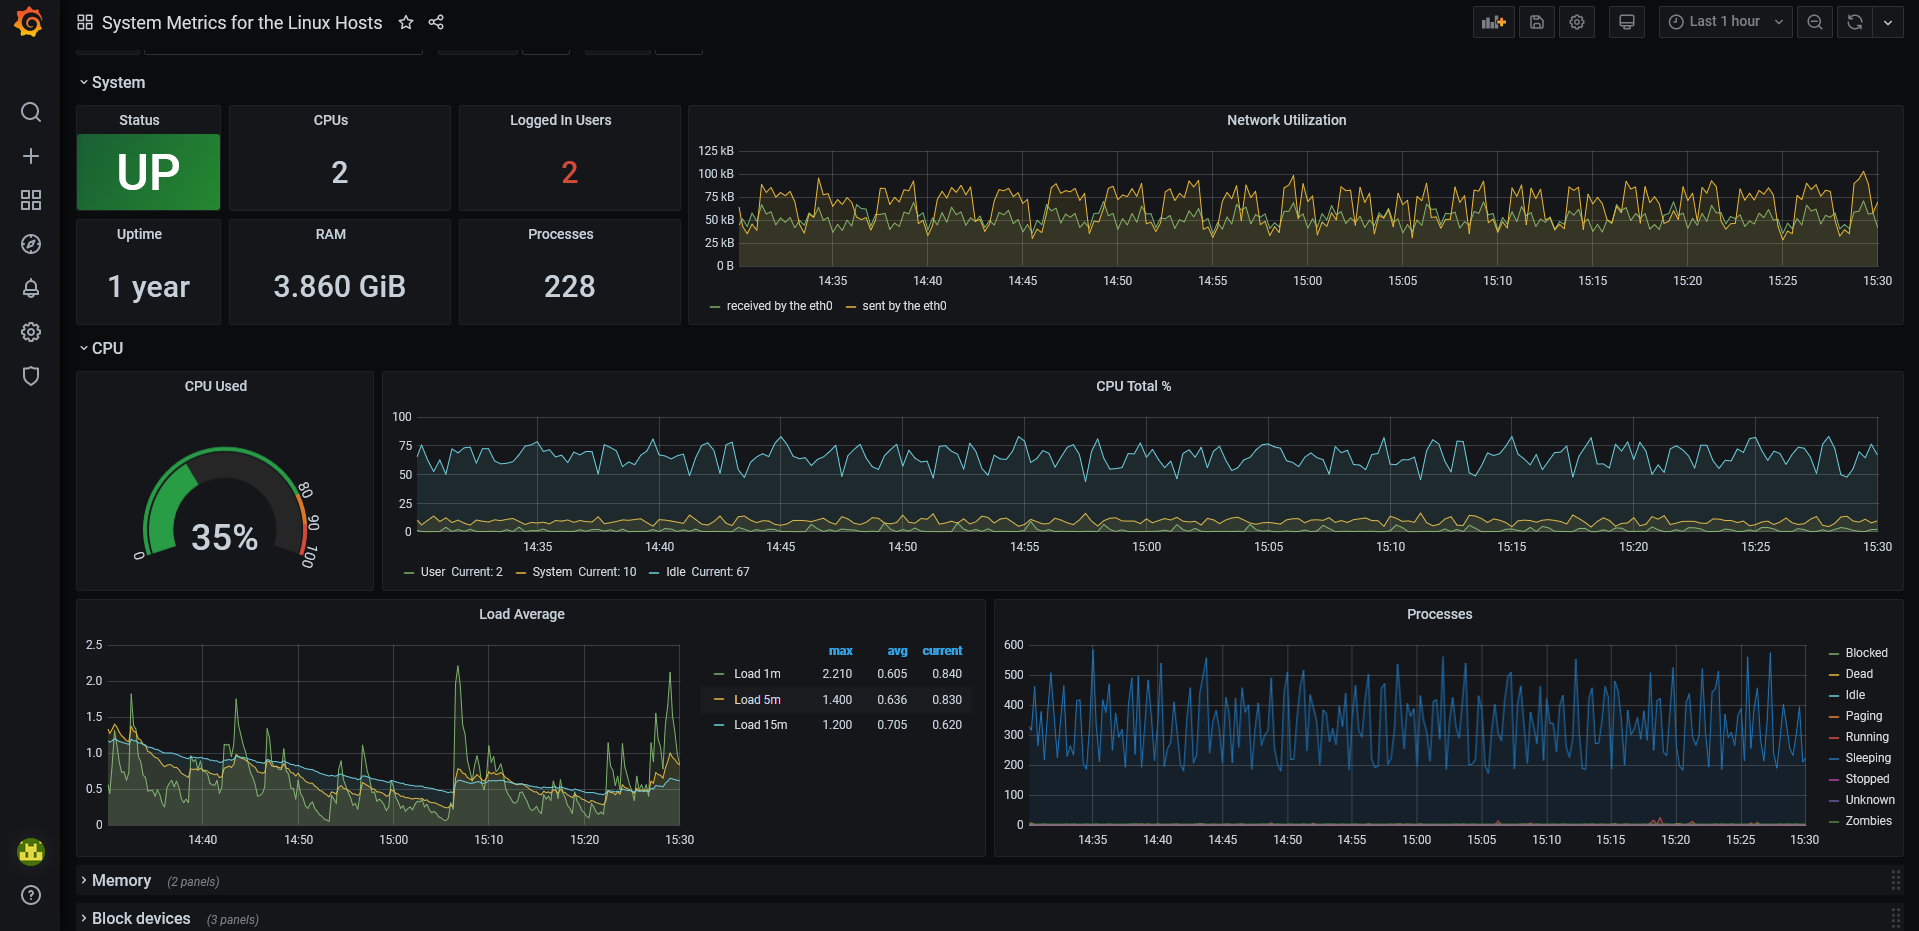
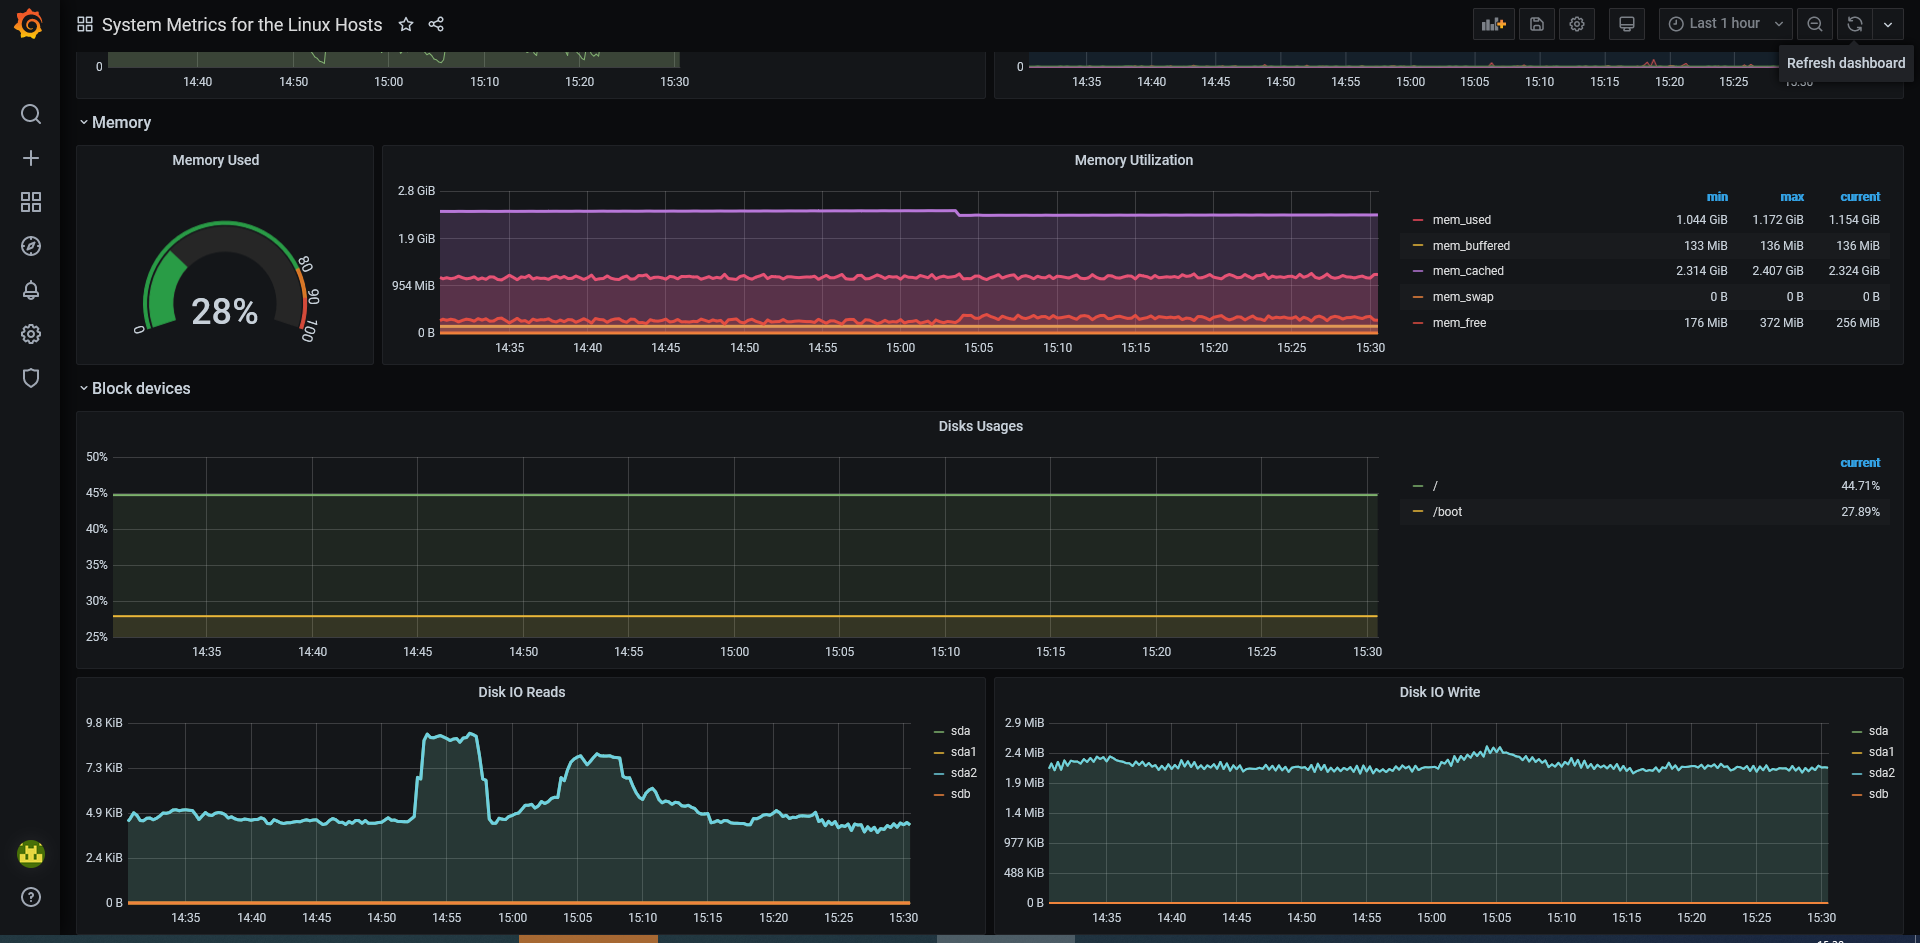
Used Metrics 88
-
up
system_n_cpus
system_n_users
net_bytes_recv
net_bytes_sent
system_uptime
mem_total
processes_total