PGbouncer 1,2851,285
This dashboard works with the pgbouncer exporter and it has the graphs for all the metics. Make you are going to add the additional label called node_ip: your server ip. Because I have created the dashboard to work with node_ip or you can the dashboard JSON file and replace with node_name.
Read my blog on how to setup this exporter to use this dashboard.
Blog Link:https://medium.com/searce/grafana-dashboard-for-pgbouncer-and-monitor-with-percona-pmm-3170d3eb4d14
If you want to contribute and make any new changes, please feel free to give a pull request here.
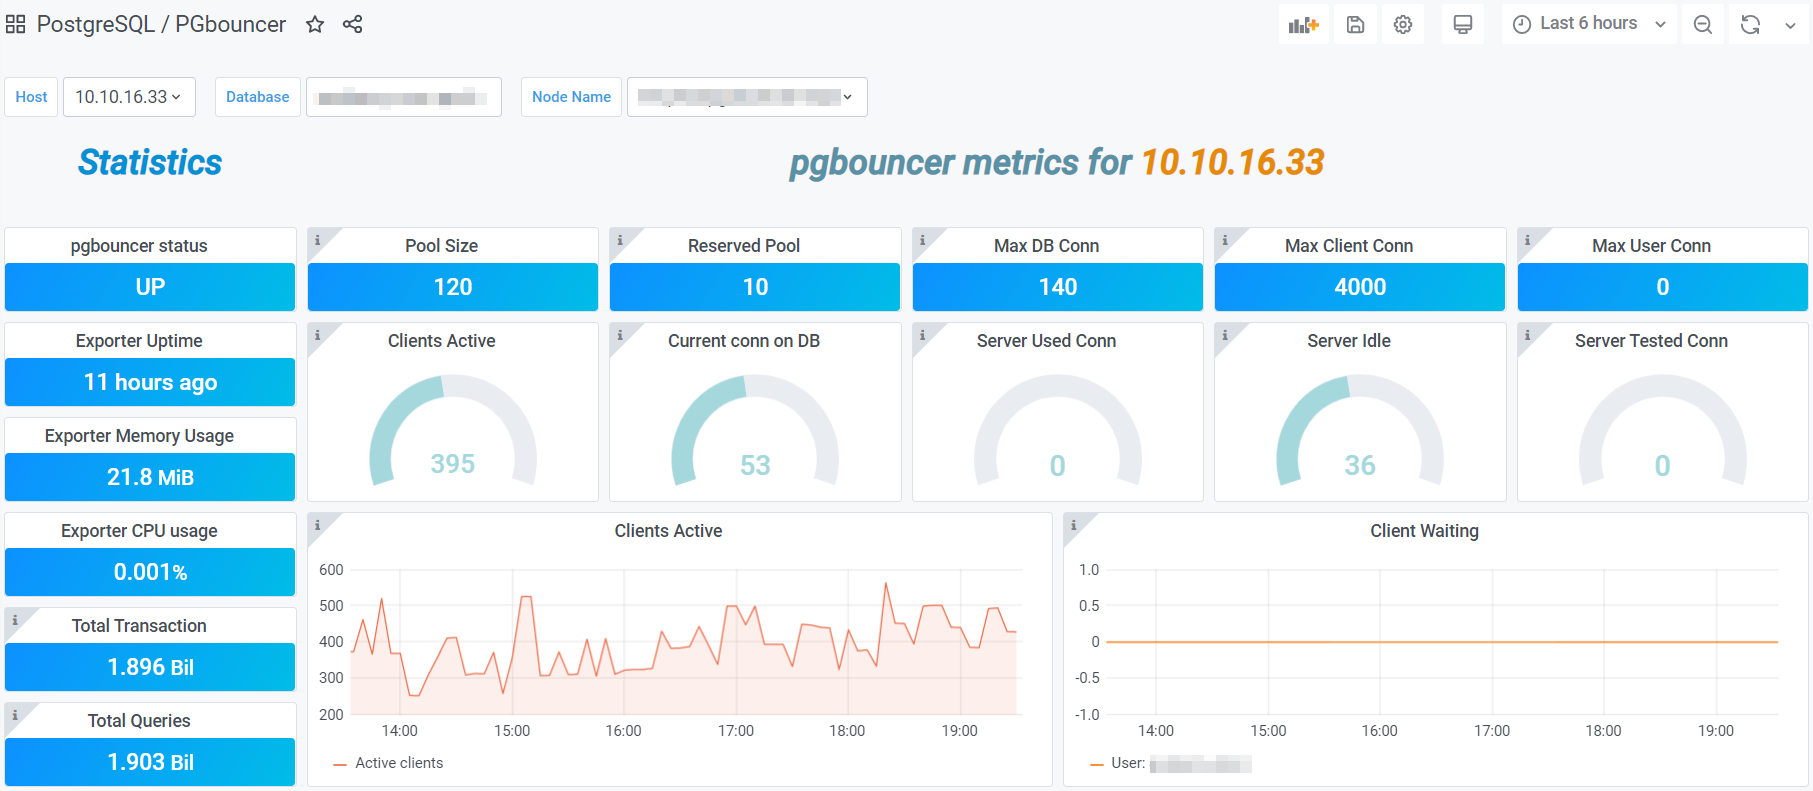
Used Metrics 2525
-
pg_up
pgbouncer_up
pgbouncer_databases_database_pool_size
pgbouncer_databases_database_reserve_pool_size
pgbouncer_databases_database_max_connections
pgbouncer_config_max_client_conn
pgbouncer_config_max_user_connections
-
process_start_time_seconds
pgbouncer_pools_client_active_connections
pgbouncer_databases_database_current_connections
pgbouncer_pools_server_used_connections
pgbouncer_pools_server_idle_connections
pgbouncer_pools_server_testing_connections
-
process_resident_memory_bytes
-
process_cpu_seconds_total
pgbouncer_pools_client_maxwait_seconds
pgbouncer_stats_transactions_total
pgbouncer_stats_queries_total
pgbouncer_stats_transactions_duration_microseconds_total
pgbouncer_pools_client_waiting_connections
pgbouncer_pools_server_login_connections
pgbouncer_stats_queries_duration_microseconds_total
pgbouncer_stats_waiting_duration_microseconds_total
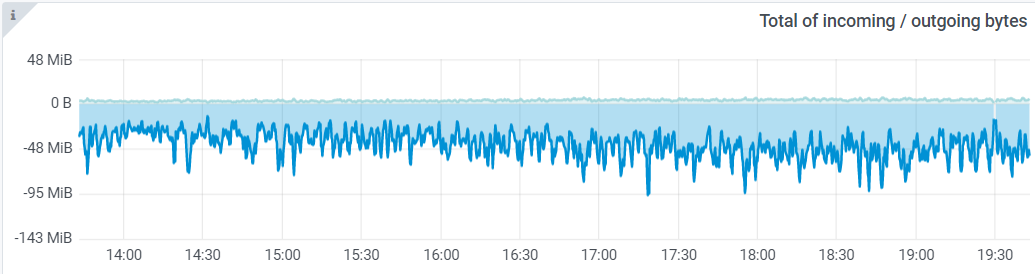
pgbouncer_stats_received_bytes_total
pgbouncer_stats_sent_bytes_total