Teku Dashboard 2,3192,319 5.0 (1 reviews)
Provides a dashboard for monitoring one or more Teku nodes which are all on the same beacon chain. The required data is exported directly from Teku to a Prometheus data store. See the documentation on how to configure Teku and Prometheus.
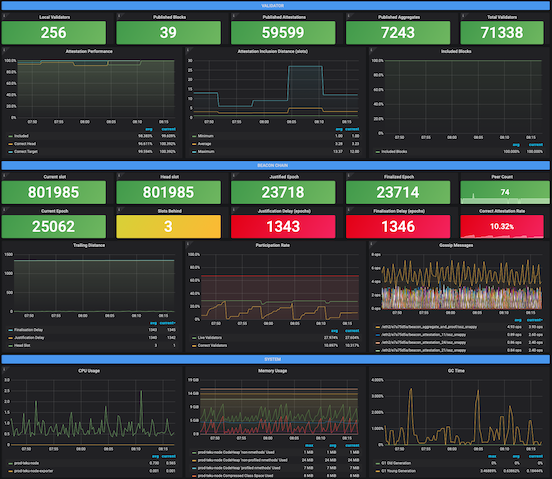
The dashboard provides information on how well connected Teku is to the network, current, justified and finalized slot and epoch information, along with CPU and memory usage statistics.
Used Metrics 3434
validator_local_validator_count
validator_beacon_node_requests_total
beacon_current_active_validators
validator_performance_included_attestations
validator_performance_expected_attestations
validator_performance_correct_head_block_count
validator_performance_correct_target_count
validator_performance_inclusion_distance_average
validator_performance_included_sync_committee_messages
validator_performance_expected_sync_committee_messages
validator_performance_produced_sync_committee_messages
validator_performance_correct_sync_committee_messages
validator_performance_inclusion_distance_min
validator_performance_inclusion_distance_max
validator_performance_included_blocks
validator_performance_expected_blocks
beacon_slot
beacon_head_slot
beacon_current_justified_epoch
beacon_finalized_epoch
beacon_peer_count
beacon_epoch
min
beacon_previous_correct_validators
beacon_previous_active_validators
beacon_previous_live_validators
beacon_previous_live_sync_committee
libp2p_gossip_messages_total
-
process_cpu_seconds_total
jvm_memory_pool_bytes_used
-
process_resident_memory_bytes
jvm_memory_pool_bytes_max
-
node_memory_MemTotal_bytes
jvm_gc_collection_seconds_sum