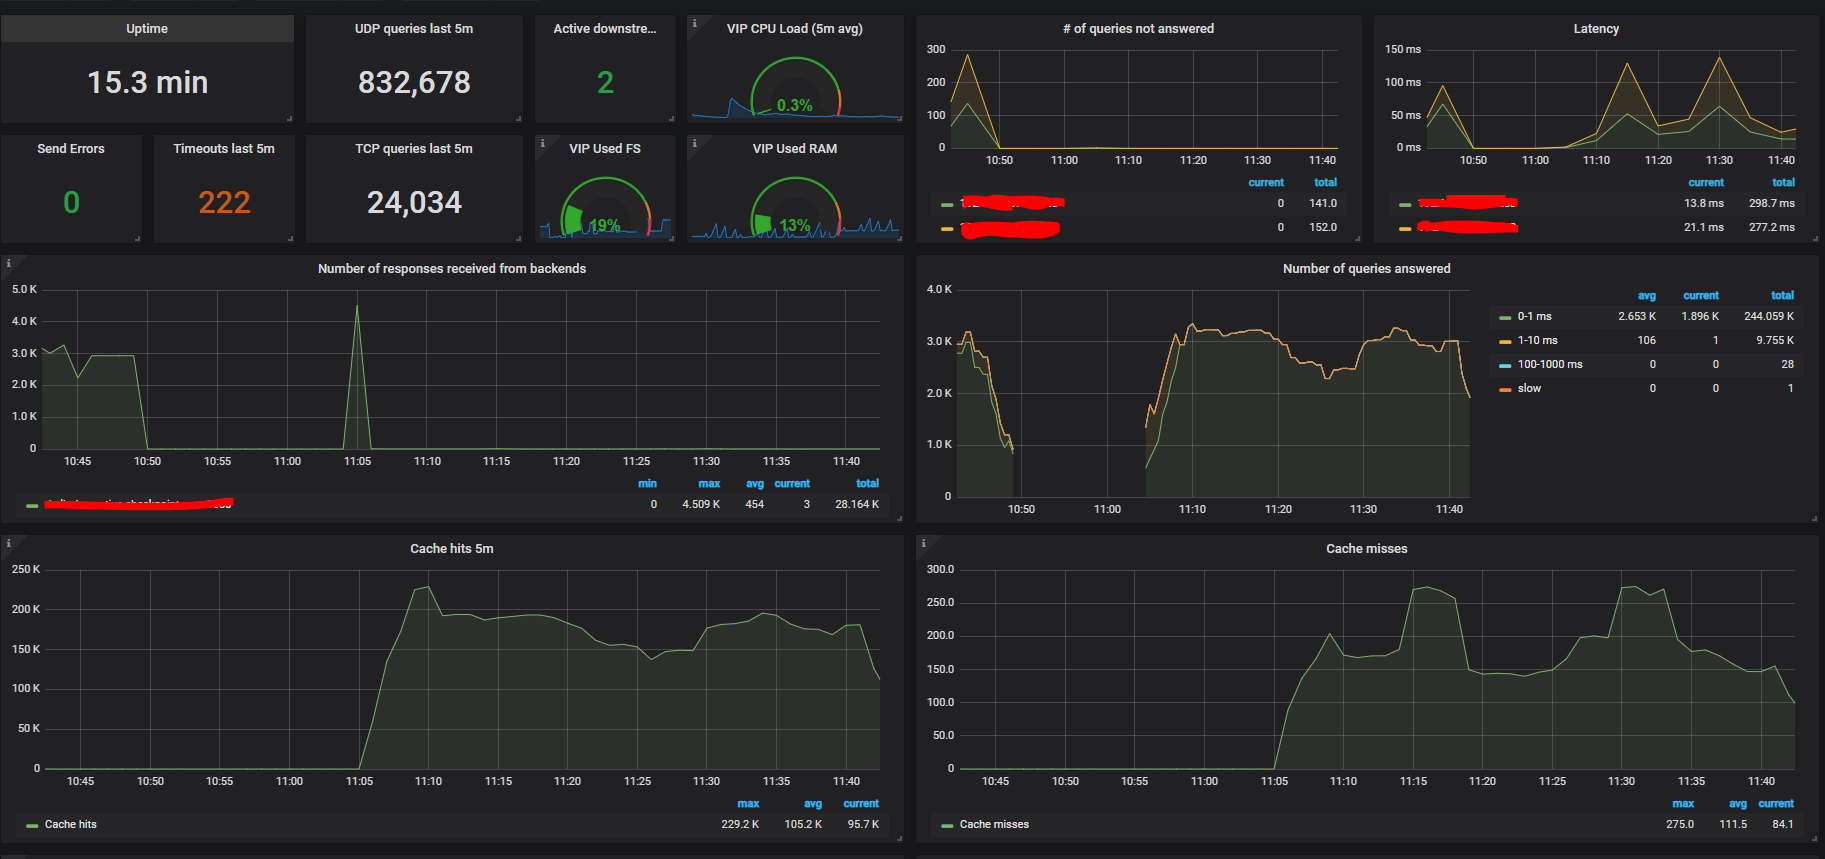
dnsdist dashboard 1,4551,455
Built using native Prometheus exporter built-into the dnsdist code.
All you need to do is to enable the built-in web server (https://dnsdist.org/guides/webserver.html) Setup your Prometheus to scrape the endpoint, import the dashboard. set your Prometheus data source and you're good to go
Rev 3. now includes caching visibility
Used Metrics 3939
dnsdist_uptime
dnsdist_frontend_queries
dnsdist_pool_active_servers
-
node_load5
-
node_cpu_seconds_total
dnsdist_server_drops
dnsdist_server_latency
dnsdist_downstream_send_errors
dnsdist_downstream_timeouts
-
node_filesystem_avail_bytes
mountpoint
fstype
rootfs
-
node_filesystem_size_bytes
-
node_memory_MemTotal_bytes
-
node_memory_MemFree_bytes
-
node_memory_MemAvailable_bytes
dnsdist_responses
dnsdist_latency0_1
dnsdist_latency1_10
dnsdist_latency10_100
dnsdist_latency100_1000
dnsdist_latency_slow
dnsdist_cache_hits
dnsdist_cache_misses
dnsdist_latency_avg1000
dnsdist_real_memory_usage
dnsdist_cpu_sys_msec
dnsdist_cpu_user_msec
device
-
node_filesystem_free_bytes
instance
-
node_memory_Cached_bytes
-
node_memory_Buffers_bytes
mode
system
-
node_network_transmit_bytes_total
lo
-
node_network_receive_bytes_total