Kubernetes Overview 19,98519,985
A live preview is available here: https://devel.lichuan.guru/grafana/d/FlUTFUYGz/kubernetes-overview?orgId=1&refresh=30s.
Username: guest
Password: Pwd123456
Dependencies
The data used in the dashboard come from the components below, assuming no relabelling were done on them. If you don't have some of them installed, or if you have configured relabeling on them, you might have to tune the dashboard to your own need.
- kube-state-metrics
- node-exporter
- kube-apiserver
- kubelet
- kubelet/cadvisor
- ETCD
Yes, this dashboard uses quite a few data sources. But these are all common components that you should be monitoring already.
CHANGELOG
[2020-02-25] Fixed potential duplicated series errors in the container related graphs. kube-state-metrics might provide duplicated series when pod changes node.
Used Metrics 4242
kube_pod_info
kube_pod_container_info
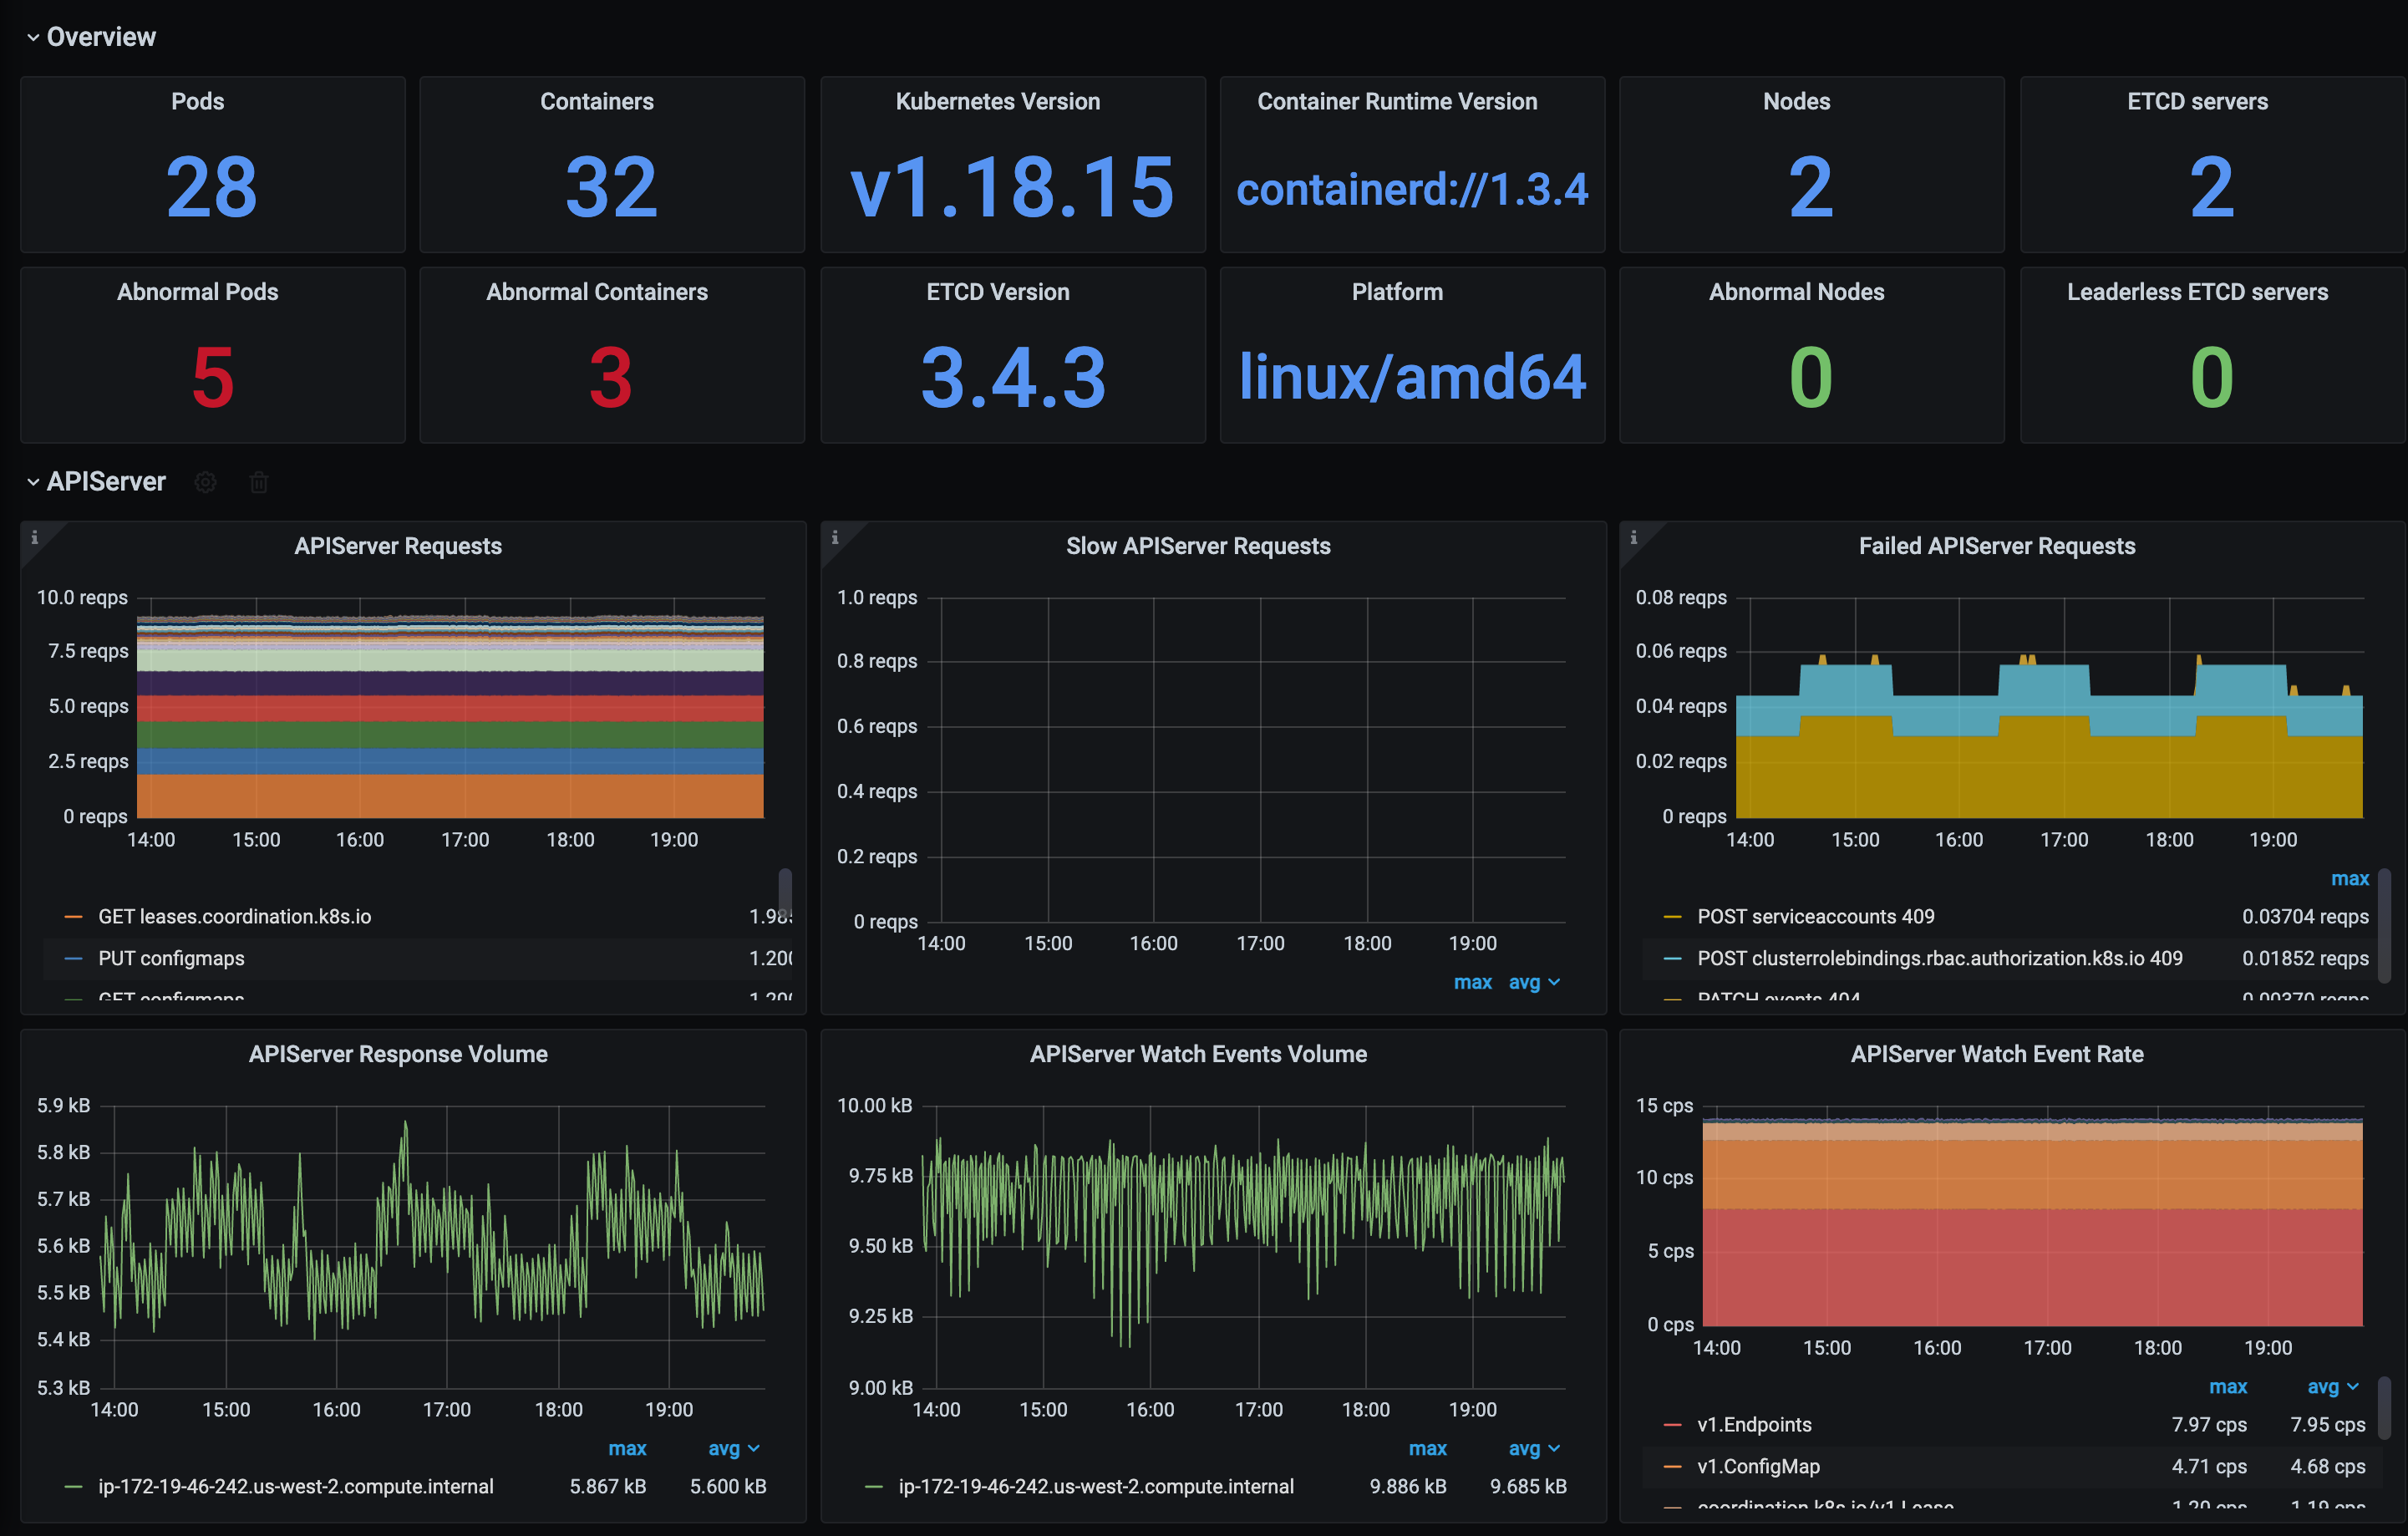
kubernetes_build_info
topk
kube_node_info
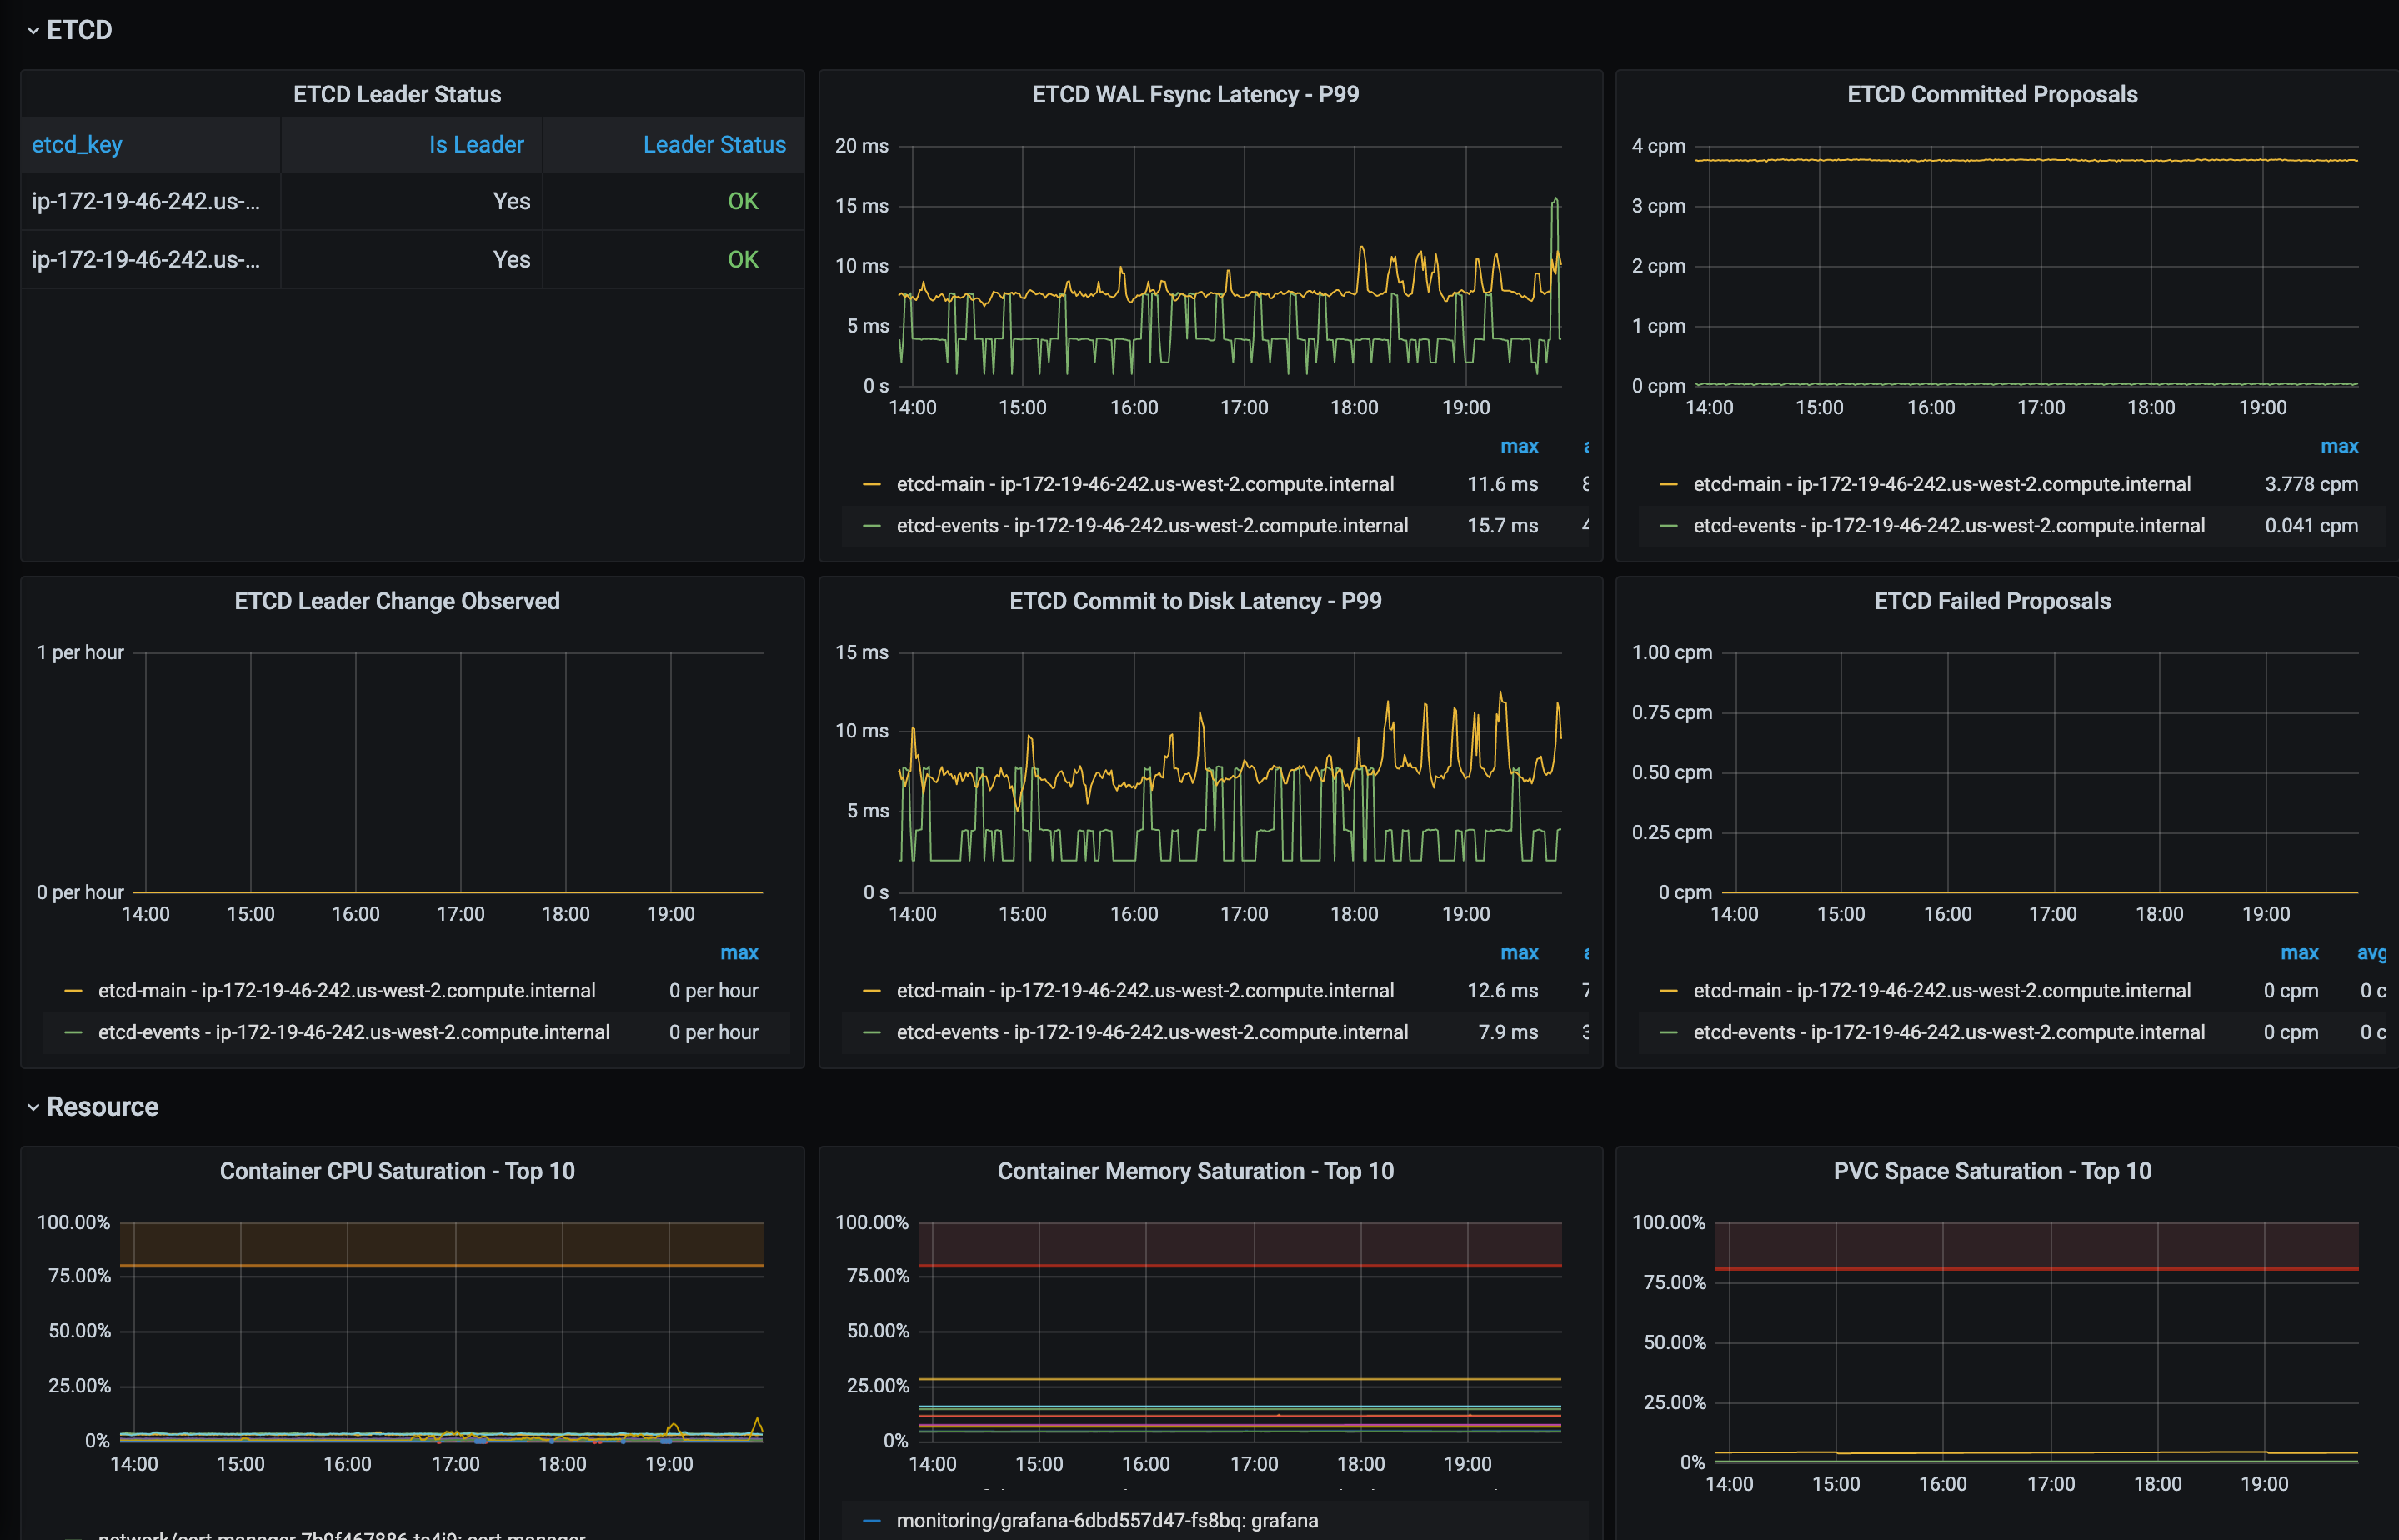
etcd_server_version
kube_pod_status_phase
kube_pod_status_ready
kube_pod_container_status_running
kube_node_status_condition
etcd_server_has_leader
apiserver_request_total
apiserver_request_duration_seconds_bucket
apiserver_response_sizes_sum
apiserver_watch_events_sizes_sum
apiserver_watch_events_total
etcd_key
instance
job
etcd_server_is_leader
etcd_disk_wal_fsync_duration_seconds_bucket
etcd_server_proposals_committed_total
etcd_server_leader_changes_seen_total
etcd_disk_backend_commit_duration_seconds_bucket
etcd_server_proposals_failed_total
-
container_cpu_usage_seconds_total
kube_pod_container_resource_limits
-
container_memory_working_set_bytes
kubelet_volume_stats_used_bytes
kubelet_volume_stats_capacity_bytes
-
node_load5
-
node_cpu_seconds_total
-
node_memory_MemAvailable_bytes
-
node_memory_MemTotal_bytes
-
node_filesystem_avail_bytes
-
node_filesystem_size_bytes
workqueue_work_duration_seconds_bucket
workqueue_depth
workqueue_retries_total
kubelet_runtime_operations_errors_total
aggregator_unavailable_apiservice
-
up