Loki stack monitoring (Promtail, Loki) 41,977,32441,977,324 4.3 (4 reviews)
3/12/2021
4/9/2021
5
>=7.3.5
PrometheusLoki
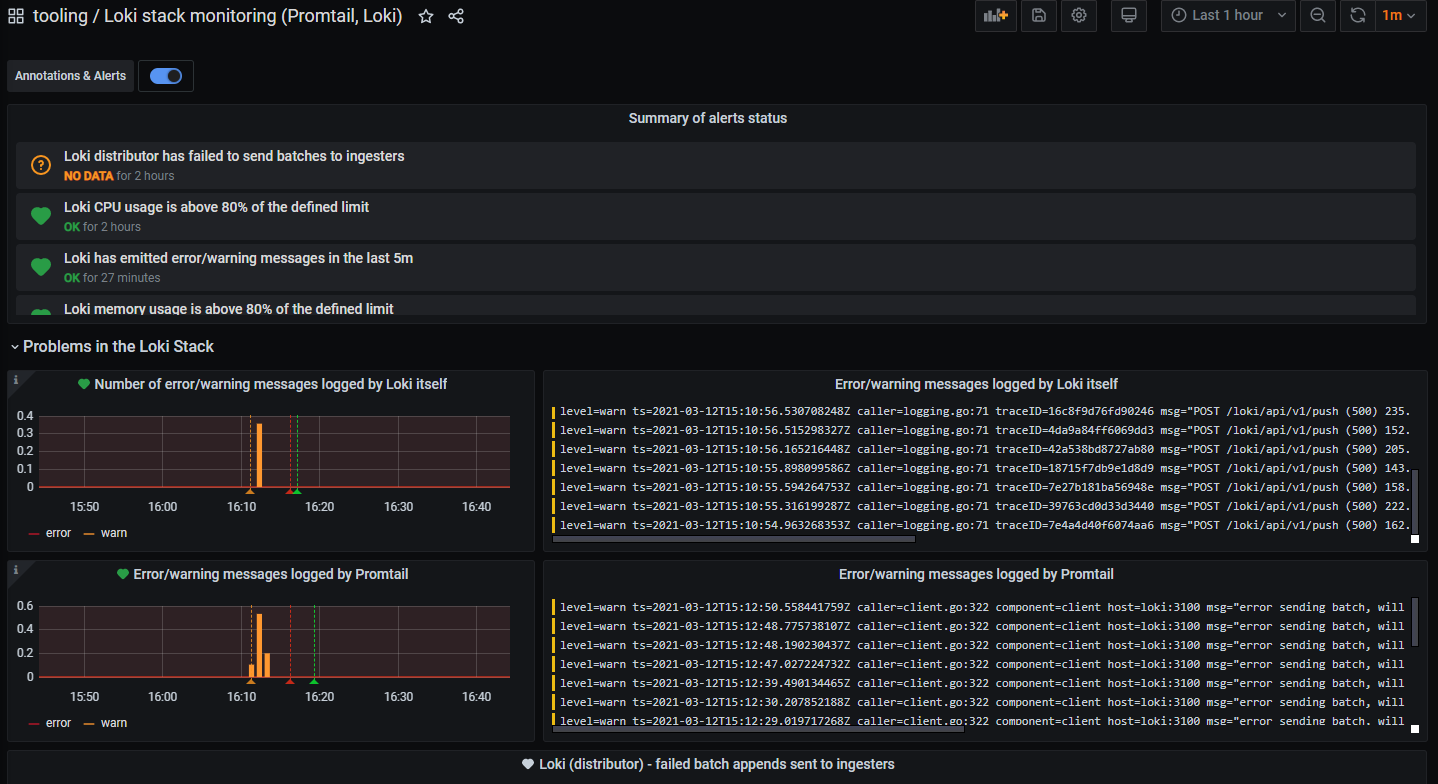
This dashboard can be used to detect issues on the Loki stack, when deployed in Kubernetes.
Shows:
- some error metrics published by Promtail/Loki
- error and warning logs emitted by Promtail/Loki
- memory and CPU usage of Promtail/Loki compared against the Kubernetes memory/cpu limits and requests.
Export Dashboard✕
Download
Copy to Clipboard
Used Metrics 1717
log_messages_total
logfmt
level
warn
error
loki_distributor_ingester_append_failures_total
promtail_dropped_entries_total
loki_ingester_memory_streams
loki_distributor_lines_received_total
loki_distributor_bytes_received_total
-
container_memory_working_set_bytes
kube_pod_container_resource_limits_memory_bytes
min
kube_pod_container_resource_requests_memory_bytes
-
container_cpu_usage_seconds_total
kube_pod_container_resource_limits_cpu_cores
kube_pod_container_resource_requests_cpu_cores