Redis Exporter Quickstart and Dashboard 268,038268,038
3/19/2021
3/19/2021
1
>=7.2.0
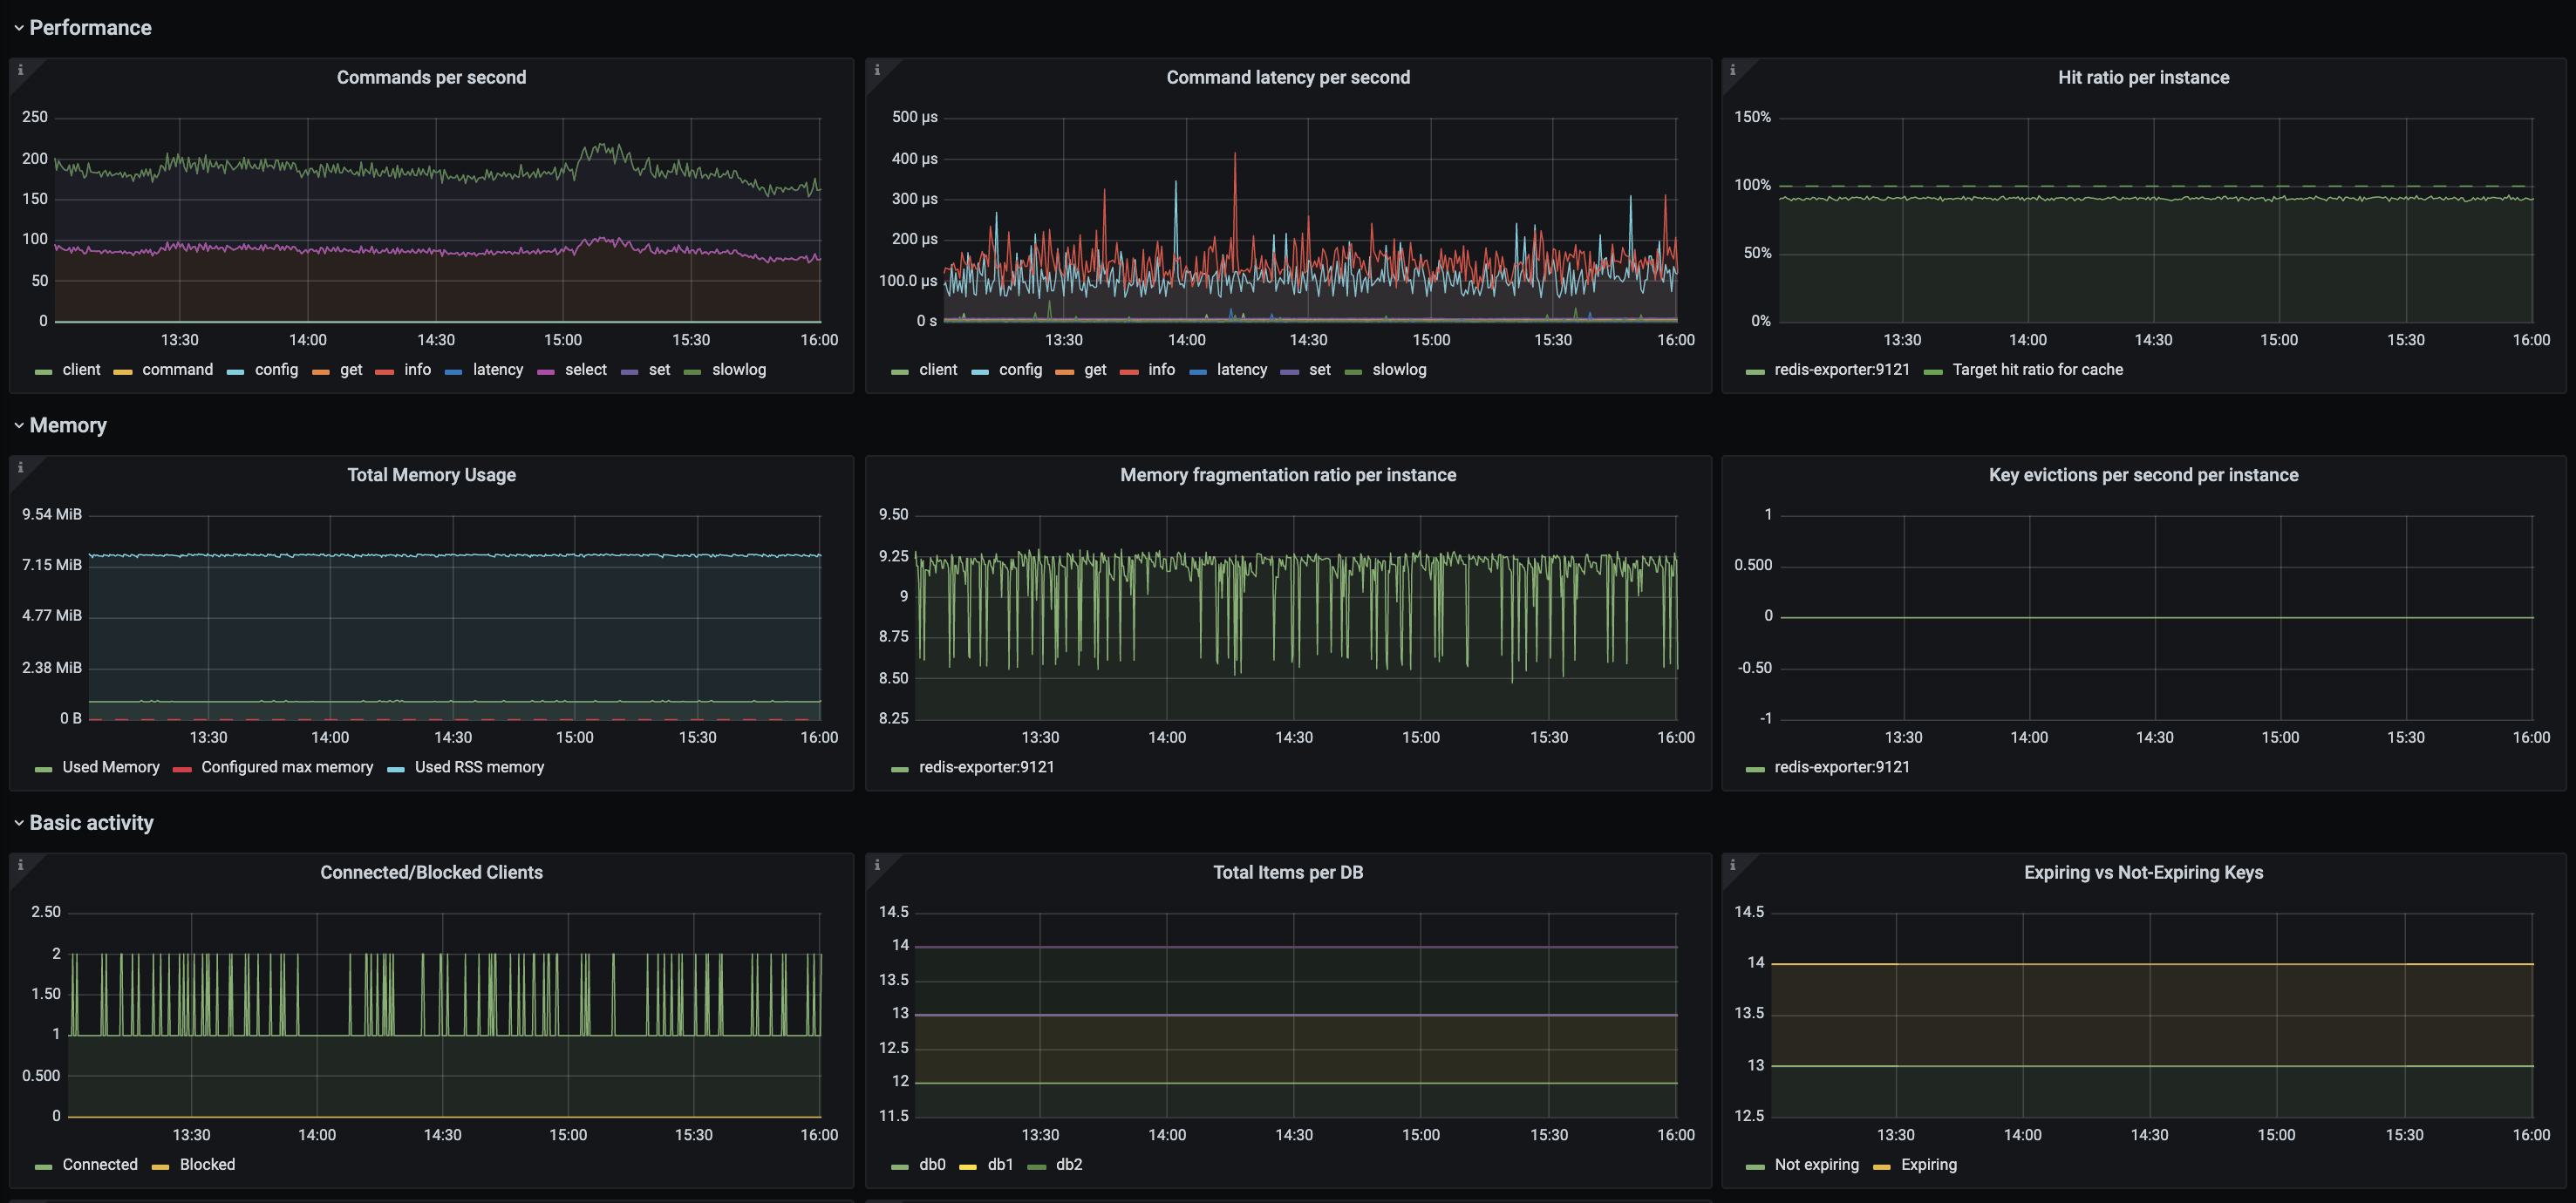
To use this dashboard, please follow the Redis Exporter Quickstart. This quickstart helps you monitor your Redis server by setting up the Prometheus Redis exporter with preconfigured dashboards, alerting rules, and recording rules. This dashboard includes panels for the following metrics:
- Commands Per Second
- Commands Latency Per Second
- Hit Ratio Per Instance
- Total Memory Usage
- Memory Fragmantation Ratio Per Instance
- Key Evictions Per Second Per Instance
- Connected/Blocked Clients
- Total Items Per DB
- Expiring vs Non-Expiring Keys
- Connected Slaves Per Instance
- Time Since Last Master Connection
This dashboard was generated using the Redis Exporter mixin.
Export Dashboard✕
Download
Copy to Clipboard
Used Metrics 1515
-
redis_commands_total
-
redis_commands_duration_seconds_total
-
redis_keyspace_hits_total
-
redis_keyspace_misses_total
-
redis_memory_used_bytes
-
redis_memory_max_bytes
-
redis_memory_used_rss_bytes
redis_memory_fragmentation_ratio
-
redis_evicted_keys_total
-
redis_connected_clients
-
redis_blocked_clients
-
redis_db_keys
-
redis_db_keys_expiring
-
redis_connected_slaves
redis_master_last_io_seconds_ago