Prometheus disk space consumption evaluation 21,21221,212
4/2/2021
4/2/2021
2
>=7.3.5
Prometheus
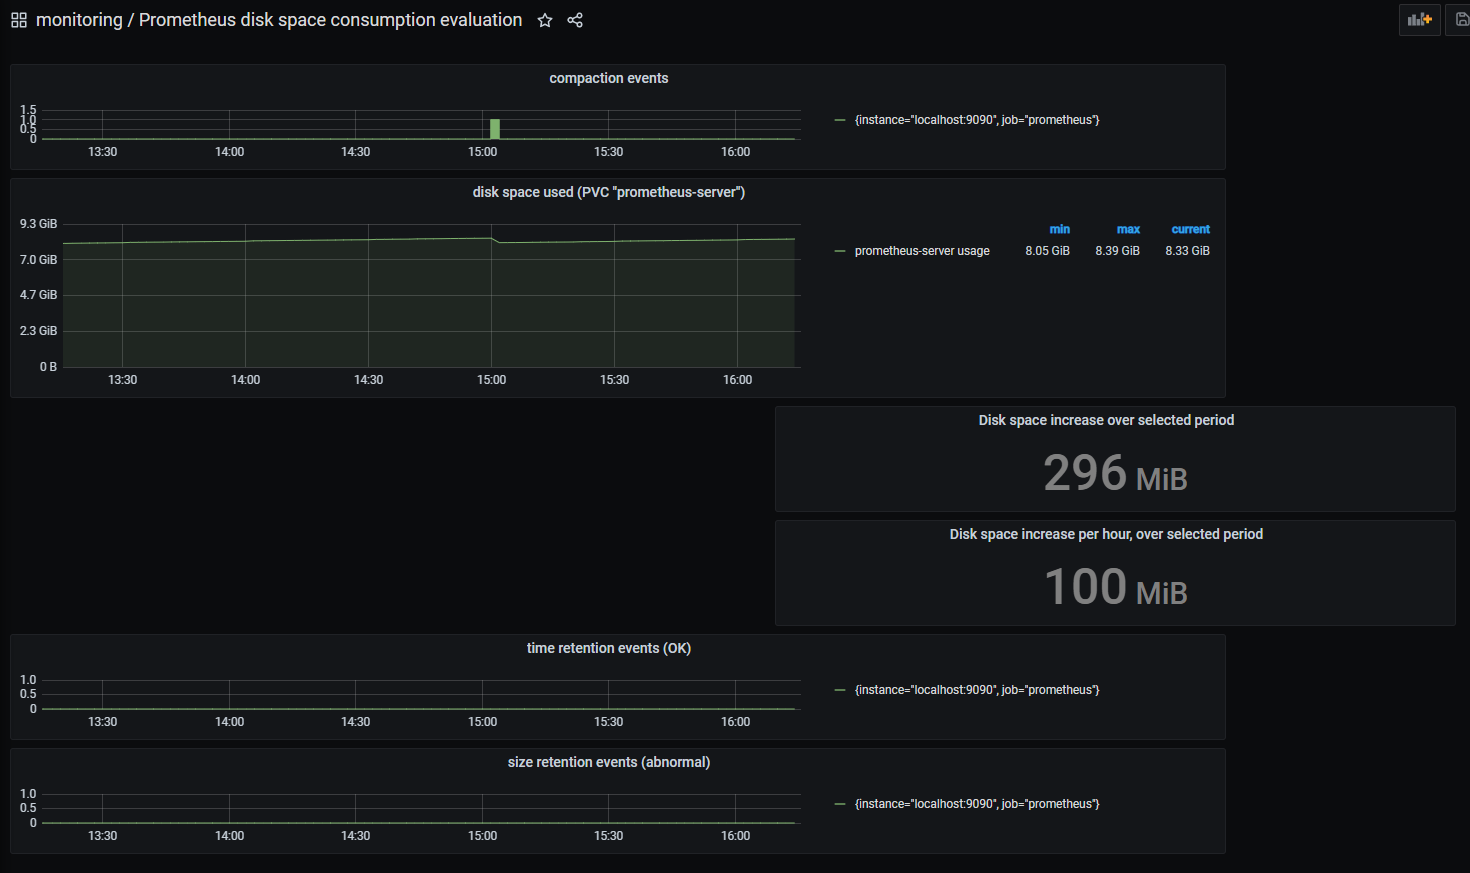
This dashboard can be useful when evaluating the disk space usage of Prometheus data, when deployed in a Kubernetes cluster.
It correlates the disk usage of the persistent volume with prometheus events: compaction, size/time retention.
It shows:
- disk space used on the persistent volume (reported by the metric "kubelet_volume_stats_used_bytes" published by kubelet)
- compaction events (reported by the metric "prometheus_tsdb_compactions_total" published by Prometheus)
- time retention events
- size retention events
Export Dashboard✕
Download
Copy to Clipboard
Used Metrics 66
-
prometheus_tsdb_compactions_total
kubelet_volume_stats_used_bytes
-
prometheus_tsdb_retention_limit_bytes
s
-
prometheus_tsdb_time_retentions_total
-
prometheus_tsdb_size_retentions_total