Cadvisor exporter 101,428101,428 4.8 (4 reviews)
4/21/2021
4/21/2021
1
>=7.4.5
Prometheus
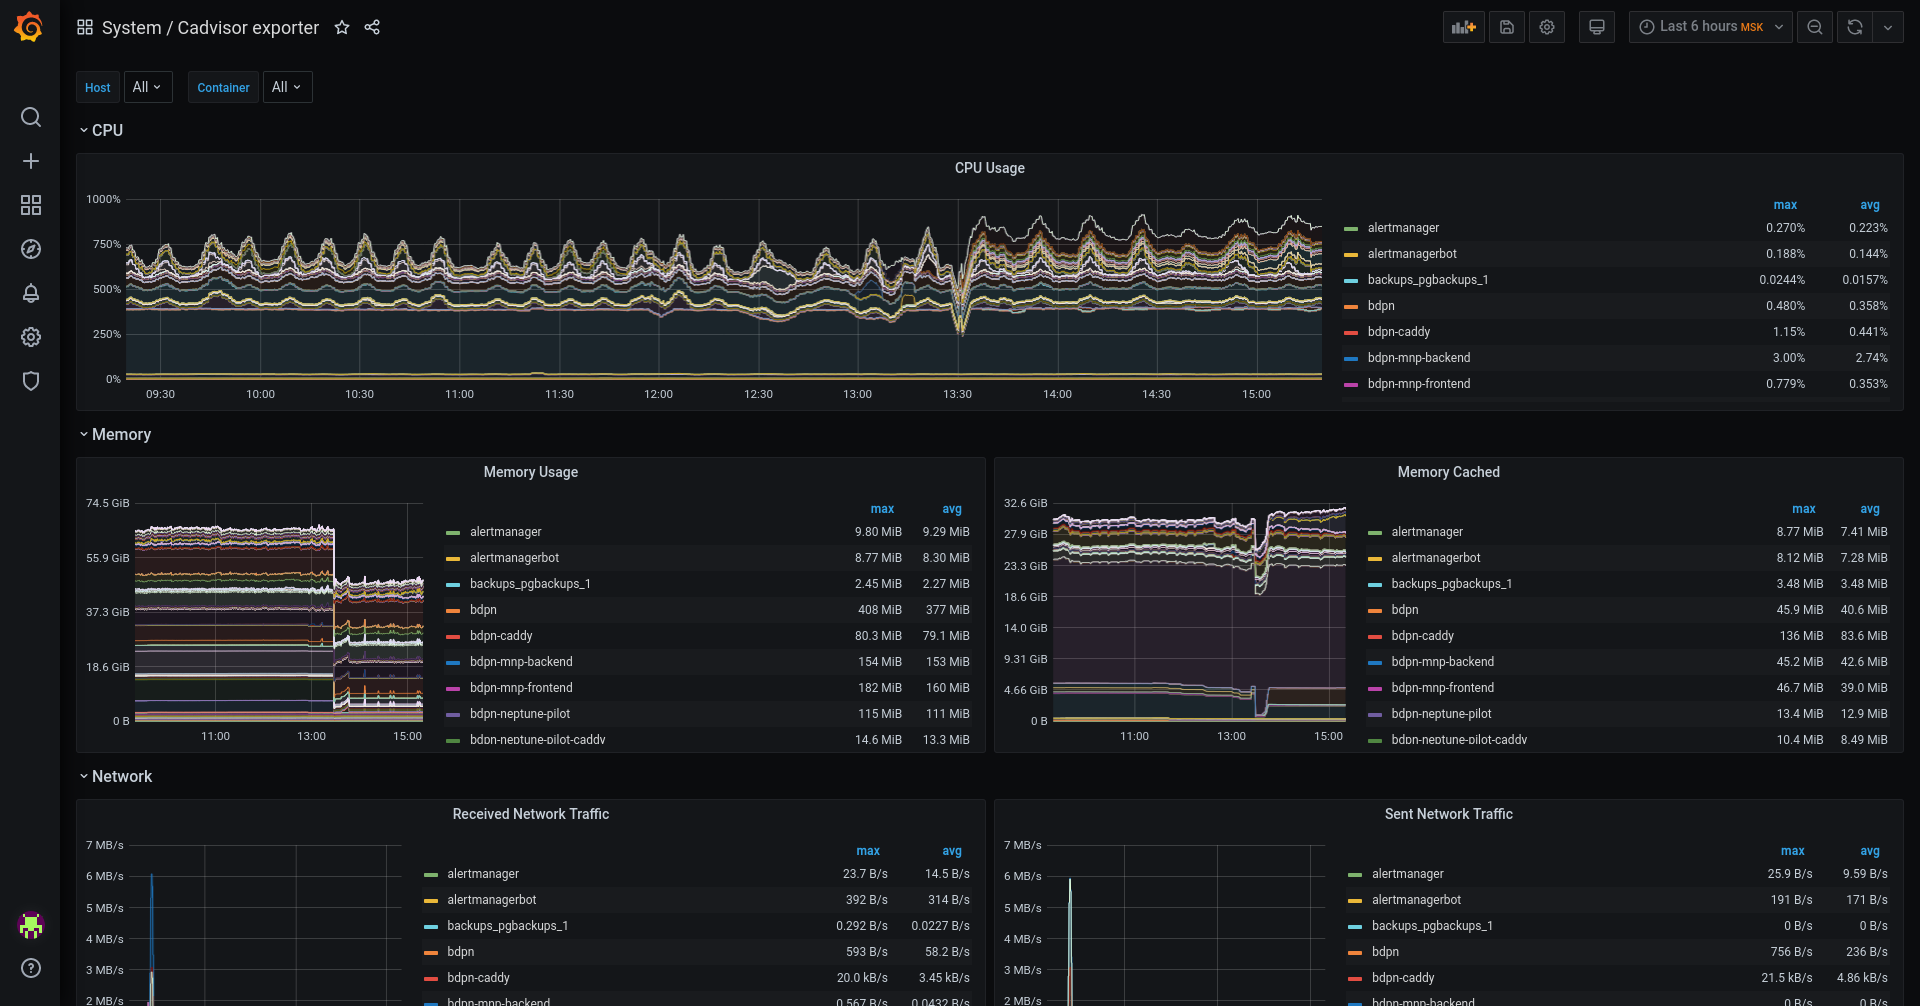
Simple set of several graphs. Just for getting Cadvisor's metrics only
Set includes:
- CPU Usage by container
- Memory Usage
- Memory Cached
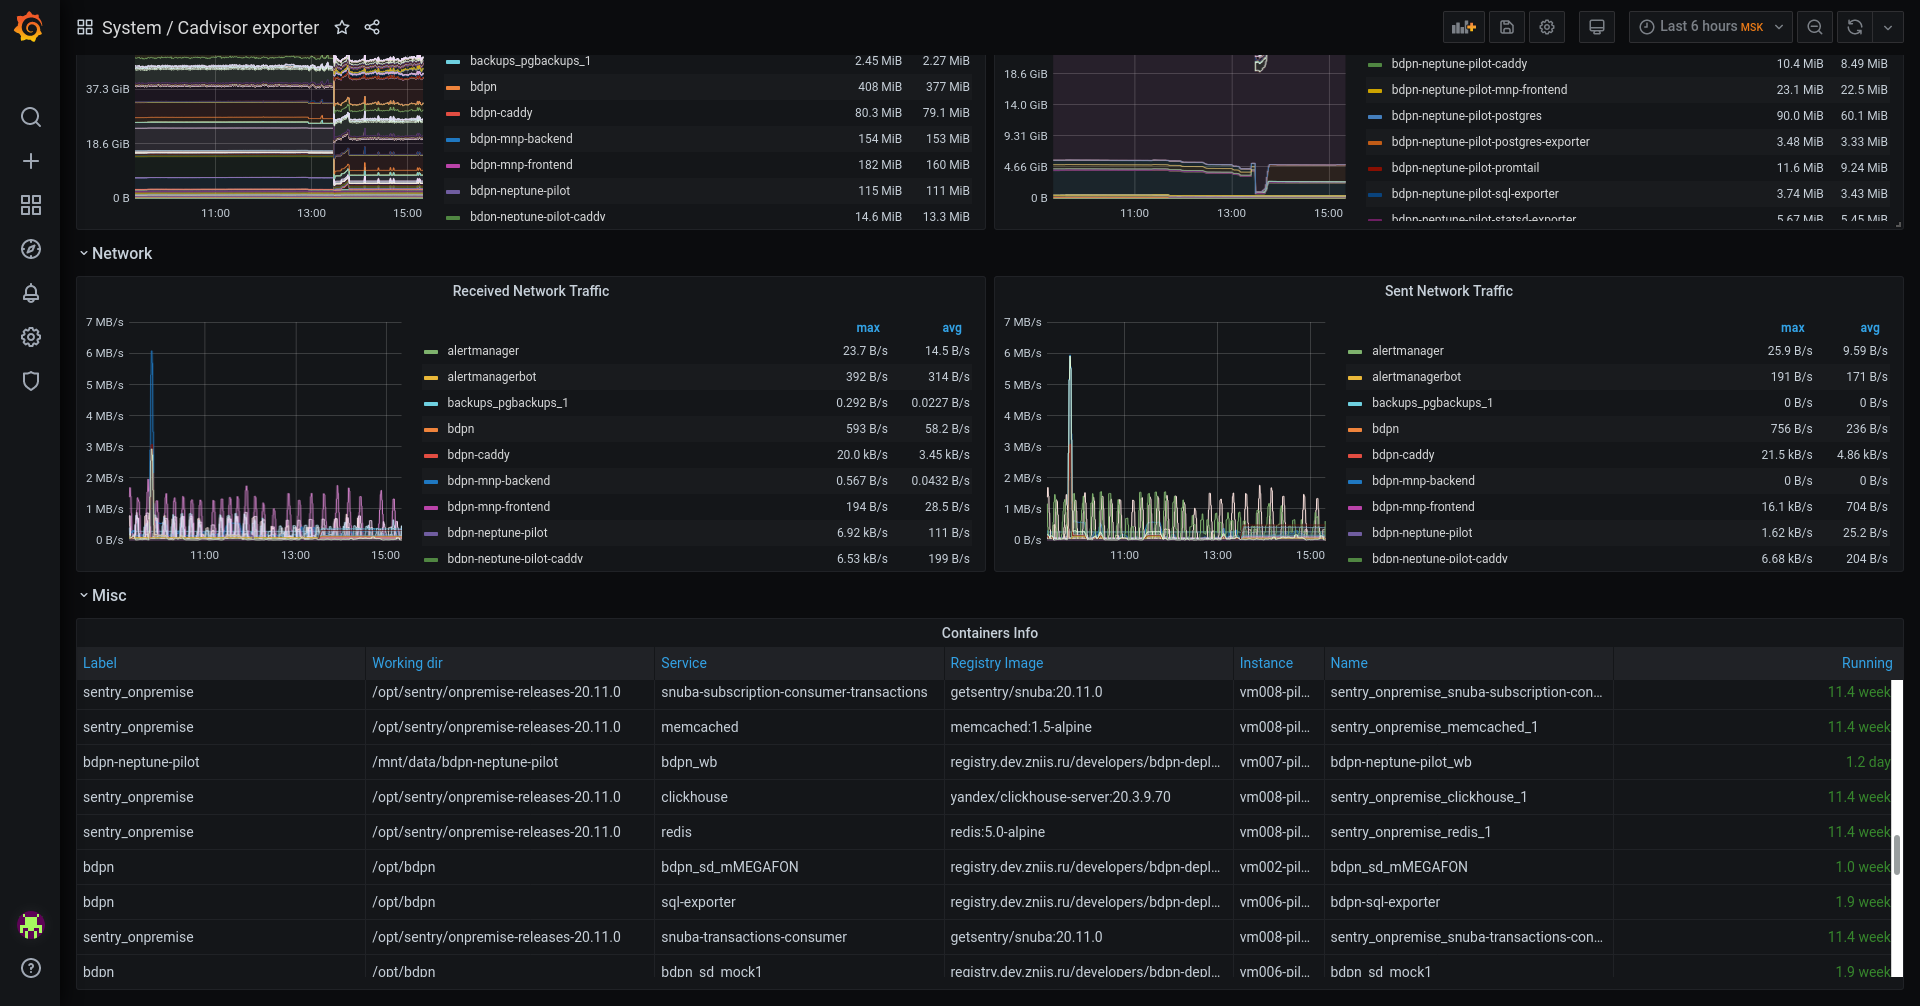
- Received Network Traffic
- Sent Network Traffic
And a table with info:
- Label
- Working dir
- Service
- Registry Image
- Instance
- Name
- Running
Export Dashboard✕
Download
Copy to Clipboard