Container resources 4,6384,638
7/4/2021
7/4/2021
1
>=8.0.3
Prometheus
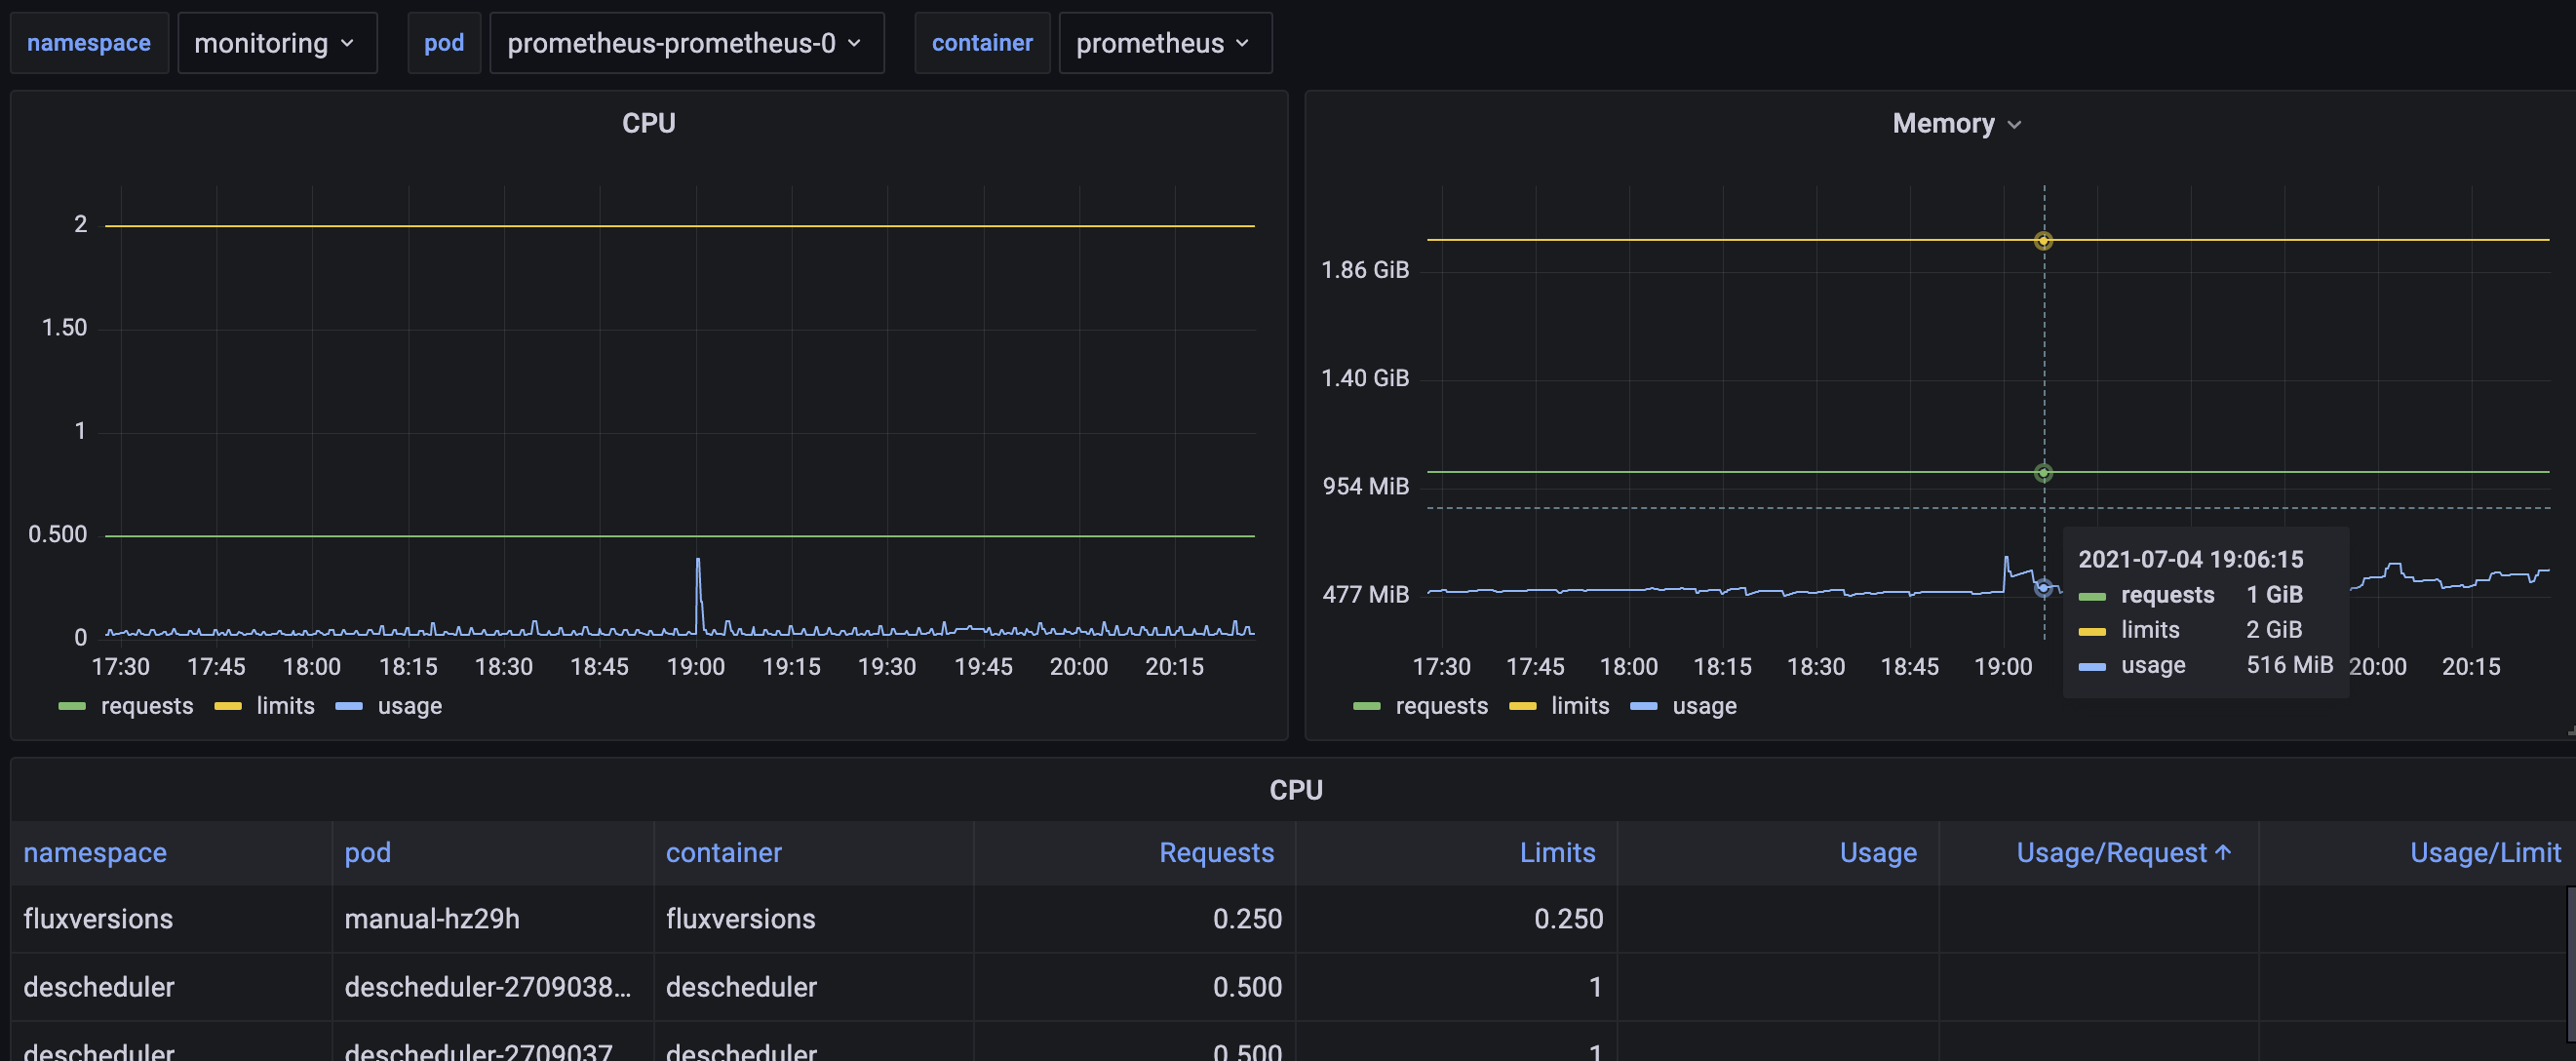
This dashboard leverages the data collected by prometheus from kube-state-metrics and kubelet/cadvisor to provide a similar experience to kube-eagle. While kube-eagle itself is a great tool, when you are already scraping kube-state-metrics and cadvisor, it is also a bit redundant.
Export Dashboard✕
Download
Copy to Clipboard
Used Metrics 44
kube_pod_container_resource_requests
kube_pod_container_resource_limits
-
container_cpu_usage_seconds_total
-
container_memory_working_set_bytes