1 Linux Stats with Node Exporter 2,7292,729 5.0 (2 reviews)
Linux Stats with Node Exporter
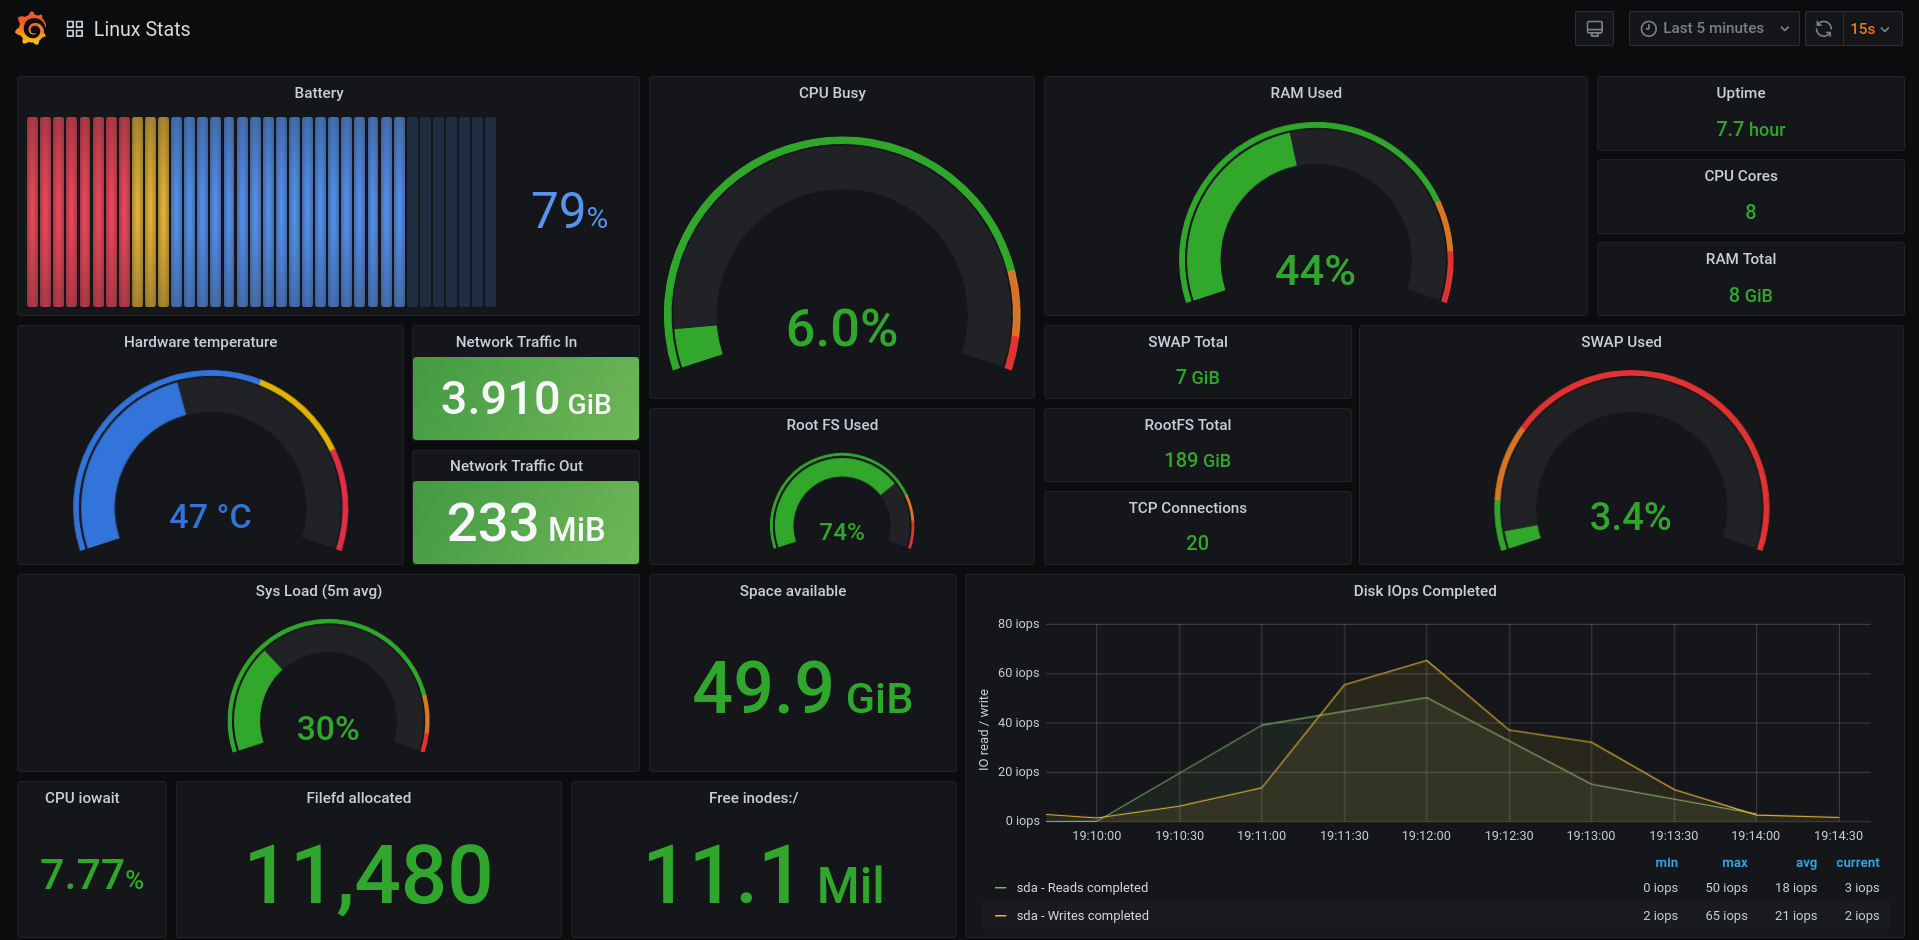
Monitoring Linux host metrics, with beautiful Grafana dashboard.
To quickly setup Prometheus node_exporter.
This dashboard includes panels for the following metrics:
- CPU Usage
- Load Average
- Network Usgae
- Memory
- Disk
- Sys basics
Variables used:
$job = label_values(node_uname_info, job)
$node = label_values(node_uname_info{job="$job"}, instance)
$network_interface = label_values(node_network_info{operstate="up"}, device)
Github: https://github.com/3xploitGuy/linuxstats
Screenshot :
[Update] :
18/07/2021
- Initial release
10/10/2021
- Added variable to detect active network interface name.
Used Metrics 1919
node_power_supply_capacity
-
node_cpu_seconds_total
-
node_memory_MemAvailable_bytes
-
node_memory_MemTotal_bytes
-
node_time_seconds
-
node_boot_time_seconds
node_hwmon_temp_celsius
-
node_network_receive_bytes_total
-
node_memory_SwapTotal_bytes
-
node_memory_SwapFree_bytes
-
node_filesystem_avail_bytes
-
node_filesystem_size_bytes
-
node_network_transmit_bytes_total
-
node_netstat_Tcp_CurrEstab
-
node_load5
-
node_disk_reads_completed_total
-
node_disk_writes_completed_total
-
node_filefd_allocated
-
node_filesystem_files_free