JMeter_Promethius_Grafana 1,4851,485
This is initial version of Dashboard using Prometheus .
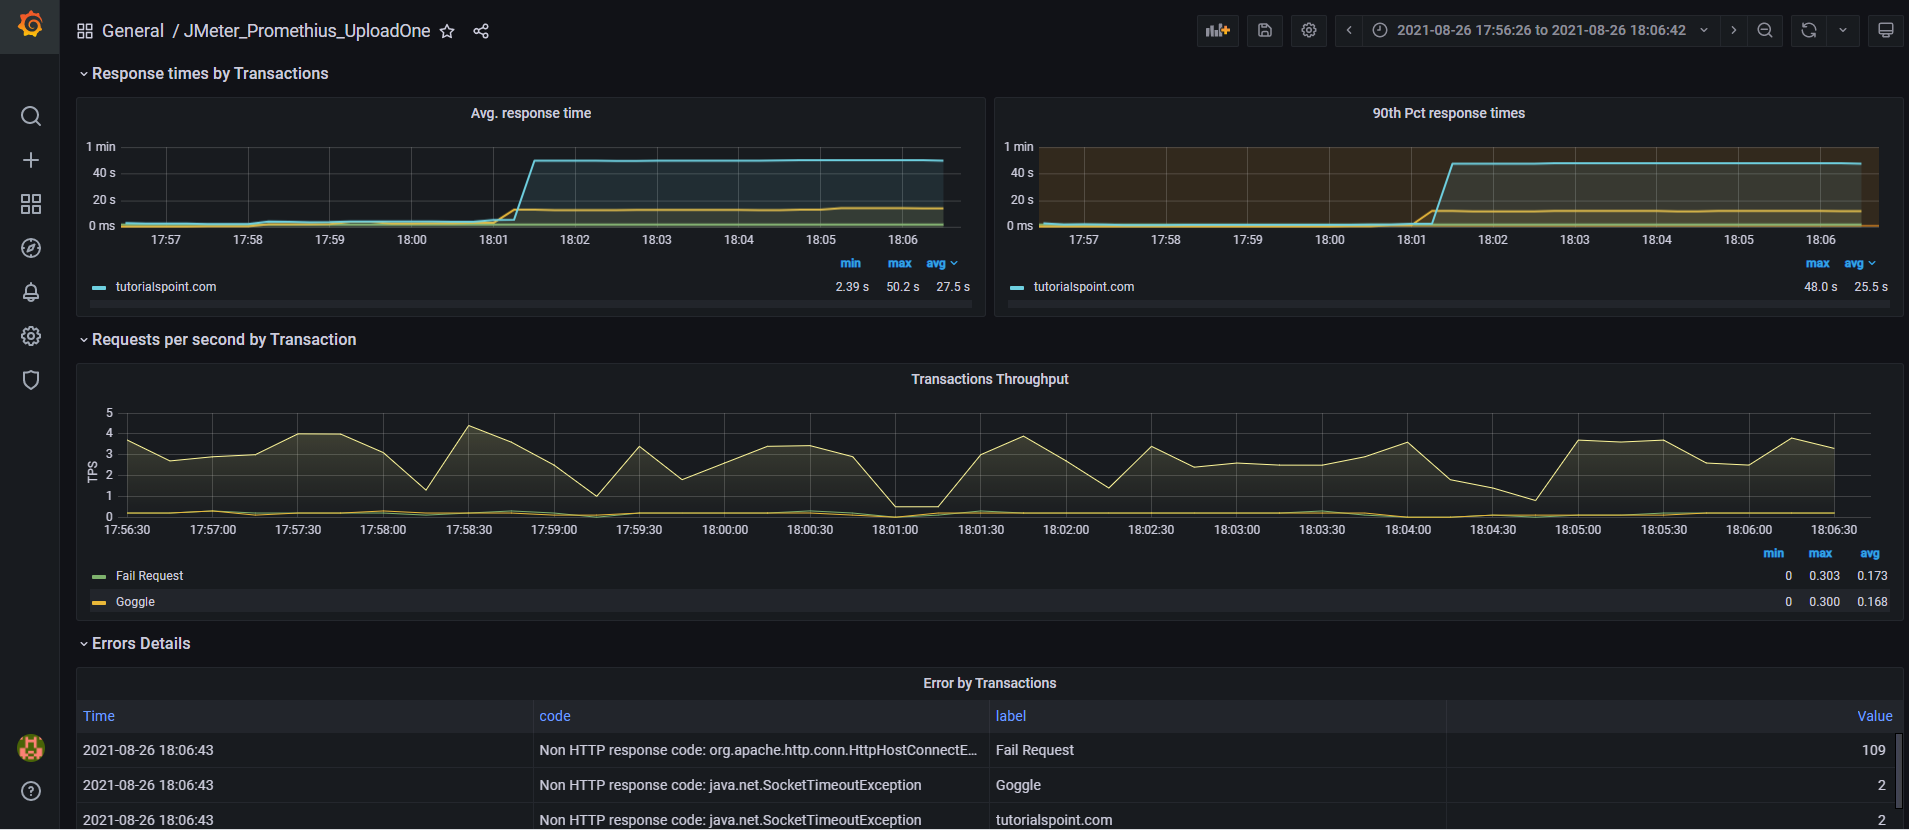
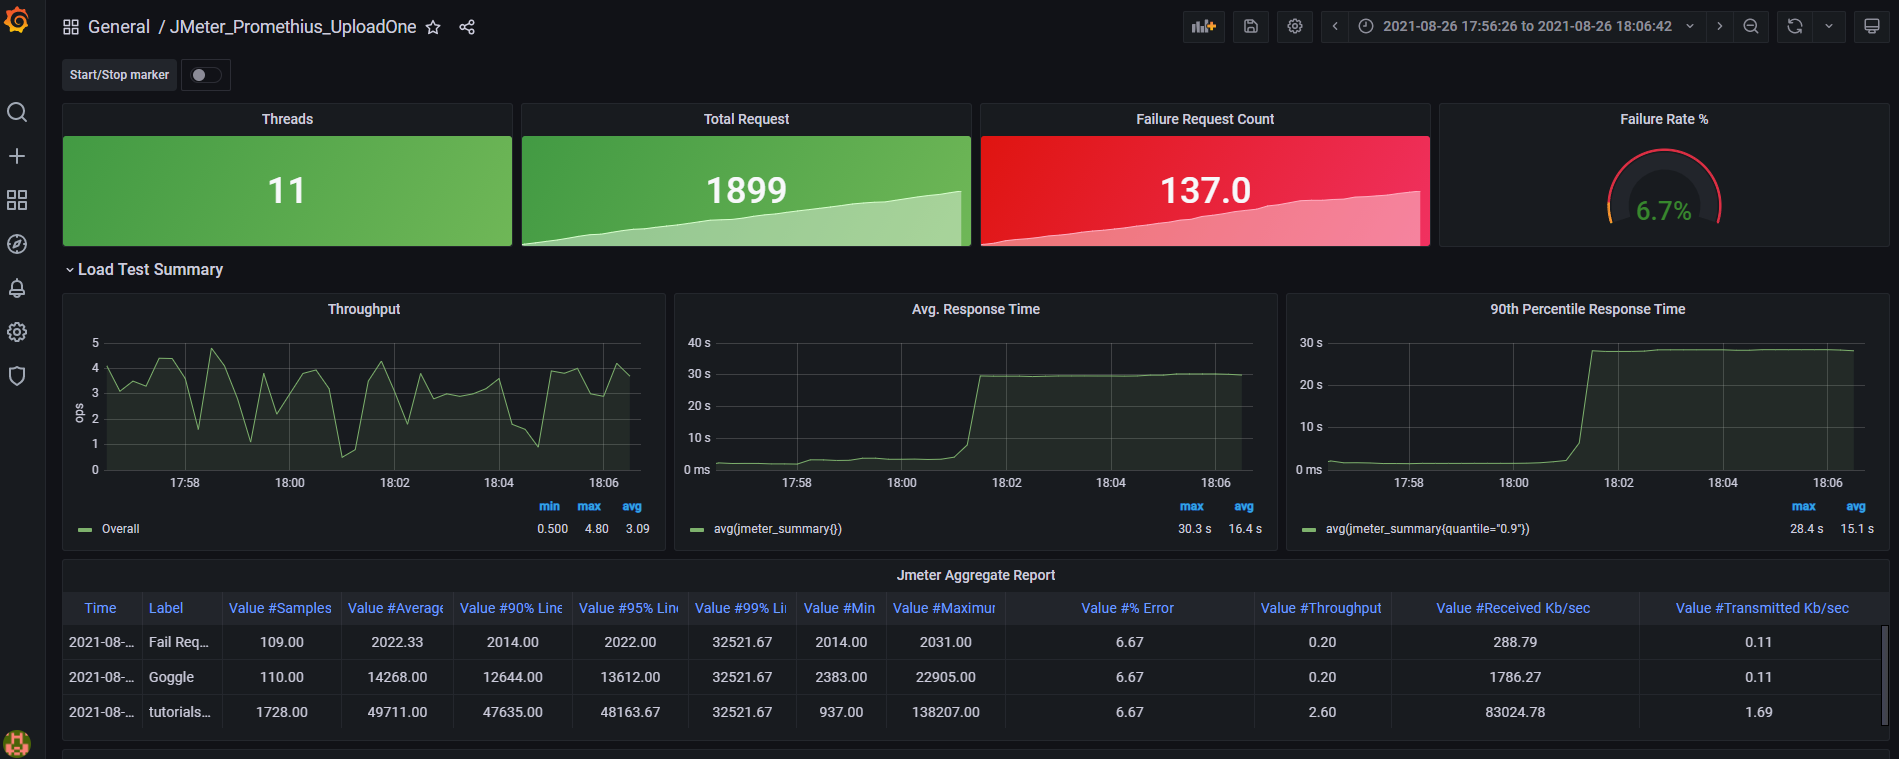
It has full of metrices which required to monitor at client side included Jmeter aggregate report as well
Prometheus and Grafana running on different different servers .
Put below changes in JMeter user.properties file in jmeter at /bin
#server.rmi.ssl.disable=false
#The port the http server will bind to
prometheus.port=9270
#The ip the http server will bind to. Containers may need 0.0.0.0 .
prometheus.ip=0.0.0.0
#The delay (in seconds) the http server will wait before being destroyed
prometheus.delay=0
#True or false value to save and collect jmeter thread metrics
prometheus.save.threads=true
#The name of the metric describing jmeter threads
prometheus.save.threads.name=jmeter_threads
#Collect metrics from the JVM
prometheus.save.jvm=true
Note : little data discrepancy you can find ..working on that
Email : vinaykr253@gmail.com
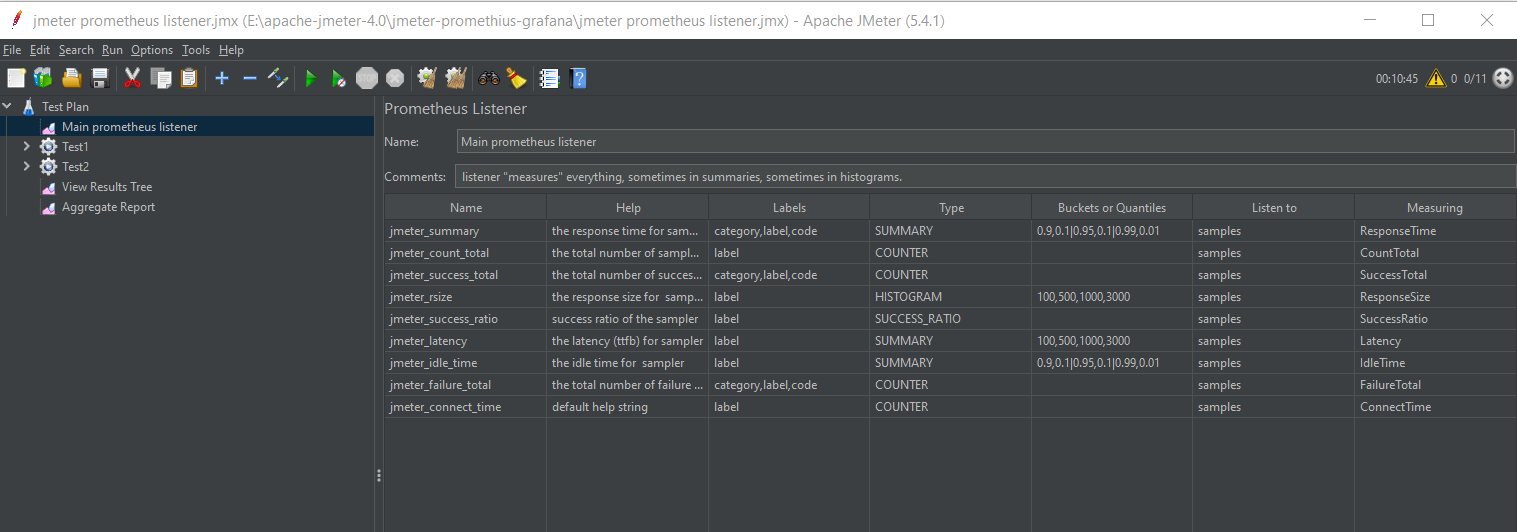
Used Metrics 1515
jmeter_threads
jmeter_count_total
jmeter_failure_total
jmeter_summary
min
jmeter_rsize_sum
jmeter_rsize_count
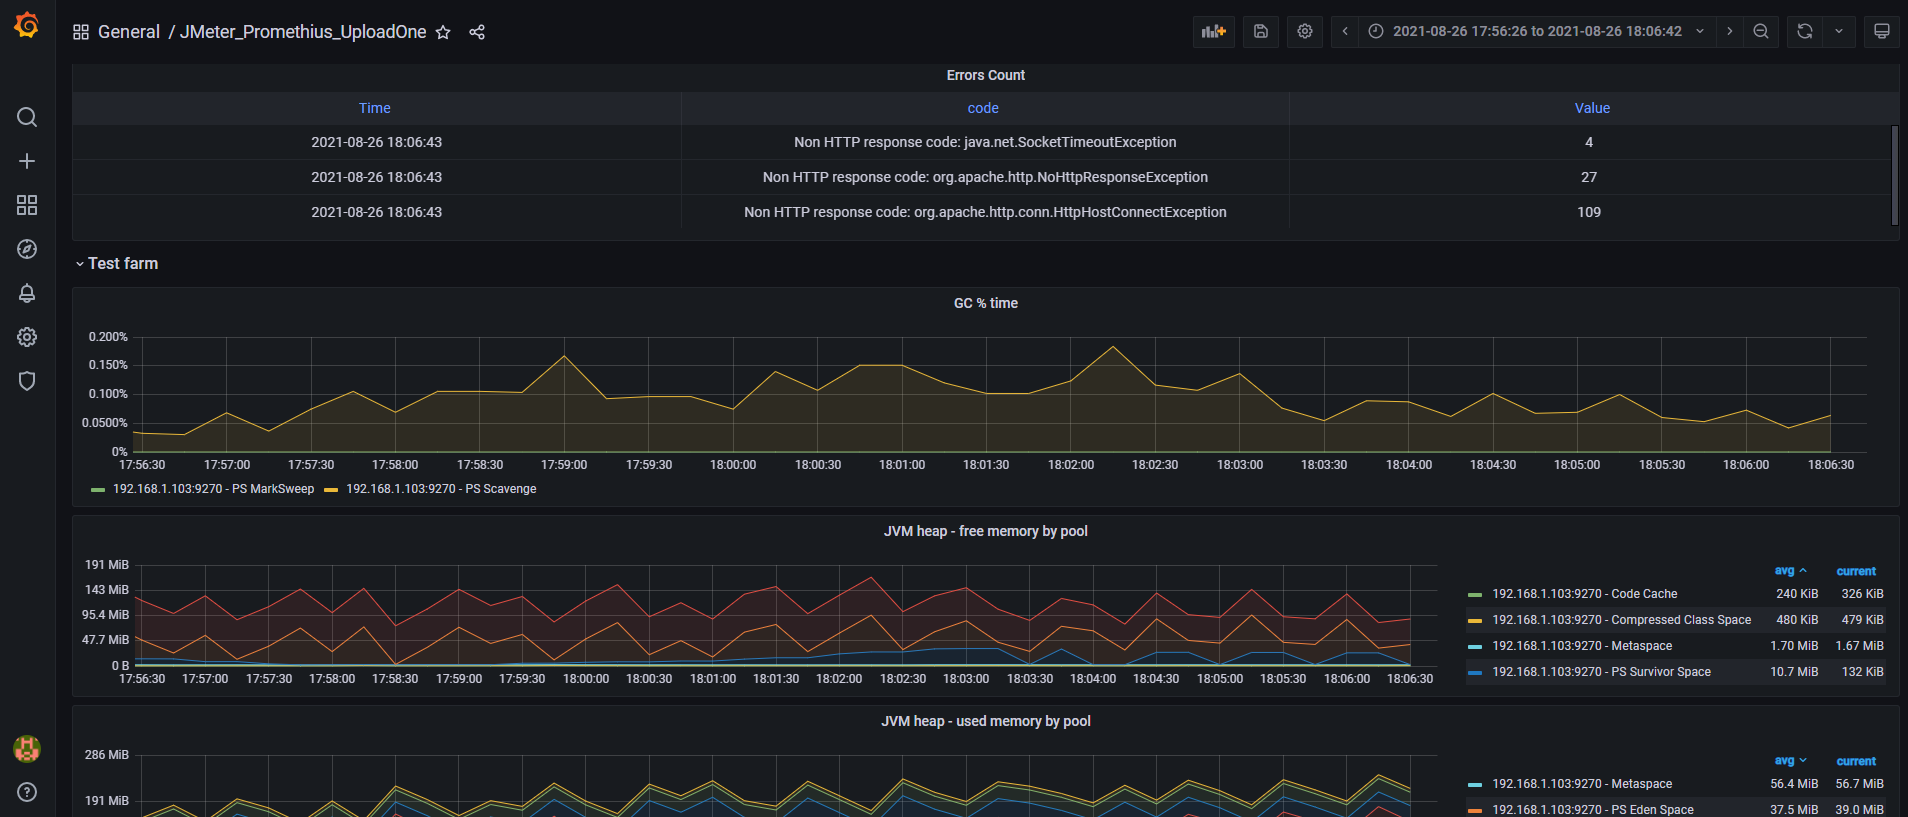
jvm_gc_collection_seconds_sum
interval
-
process_cpu_seconds_total
jvm_gc_collection_seconds_count
jvm_memory_pool_bytes_committed
jvm_memory_pool_bytes_used
jvm_memory_bytes_max
jvm_memory_bytes_used