CoreDNS 40,620,57240,620,572
A recommended modification for your own dashboard
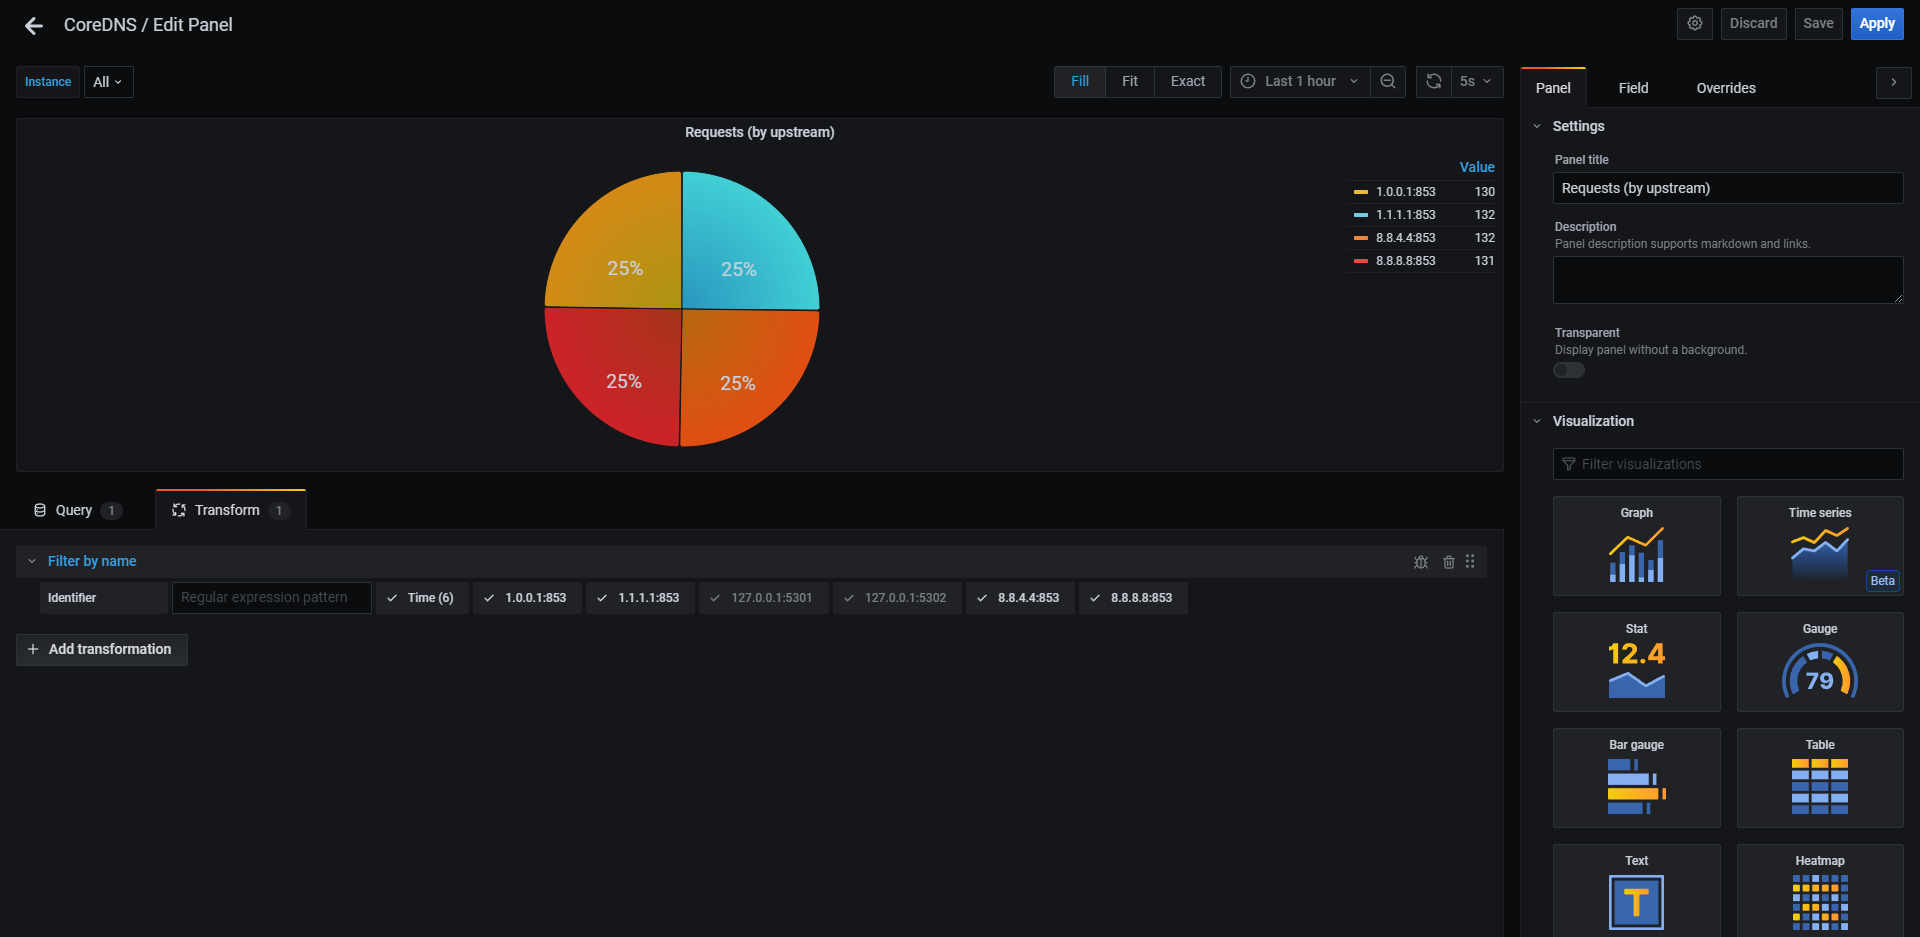
The "Requests (upstream)" piechart should be modified to fit your needs. Edit the panel, go to the "Transform" tab, and exclude (or re-include) any DNS servers from the pie chart that you wish. This is shown in the last screenshot.
Updates
Update 09/26/21
- Fixed "Cache (hitrate)" panel
- Updated graphs to no longer use "missed" metrics
Used Metrics 2222
coredns_dns_requests_total
coredns_build_info
coredns_forward_healthcheck_broken_total
coredns_forward_max_concurrent_rejects_total
coredns_panics_total
coredns_reload_failed_total
-
process_cpu_seconds_total
-
go_memstats_alloc_bytes
coredns_cache_requests_total
coredns_dns_request_duration_seconds_bucket
coredns_cache_hits_total
coredns_dnssec_cache_hits_total
coredns_dns_do_requests_total
coredns_dns_responses_total
coredns_dns_request_size_bytes_bucket
coredns_dns_response_size_bytes_bucket
coredns_cache_entries
coredns_dnssec_cache_entries
coredns_forward_requests_total
coredns_forward_conn_cache_hits_total
coredns_forward_request_duration_seconds_bucket
coredns_forward_responses_total