MongoDB 92,54292,542 5.0 (2 reviews)
9/12/2021
9/13/2021
3
Databases
>=7.4.5
Prometheus
Dependencies: Add Prometheus job to get data from mongodb cluster:
    - job_name: mongodb
      scrape_interval: 5s
      static_configs:
        - targets: ['example-mongodb-svc.mongodb:9216']
Edit statefulset adding with your informations:
You need to change someDBs with: yourDatabase.yourCollection Example: config.transactions
and
create the metrics-user with permissions to get the necessary information from your database.
- name: mongodb-exporter
  image: bitnami/mongodb-exporter:0.20.6
  command: ["/bin/sh"]
  args: ["-c", '/opt/bitnami/mongodb-exporter/bin/mongodb_exporter --discovering-mode --mongodb.indexstats-colls=someDBs --mongodb.collstats-colls=someDBs --web.listen-address=":9216" --web.telemetry-path="/metrics" --mongodb.direct-connect=false --mongodb.uri="mongodb://${DBUSER}:${DBPASS}@${DBURL}/admin?ssl=false"']
  imagePullPolicy: Always
  env:
    - name: DBURL
      value: "localhost:27017"
    - name: DBUSER
      value: "metrics-user"
    - name: DBPASS
      valueFrom:
        secretKeyRef:
          name: metrics-user
          key: password
  ports:
  - name: metrics
    containerPort: 9216
    protocol: TCP
  resources:
    limits:
      cpu: "500m"
      memory: 800M
    requests:
      cpu: "500m"
      memory: 500M
  securityContext:
    allowPrivilegeEscalation: false
Export Dashboard✕
Download
Copy to Clipboard
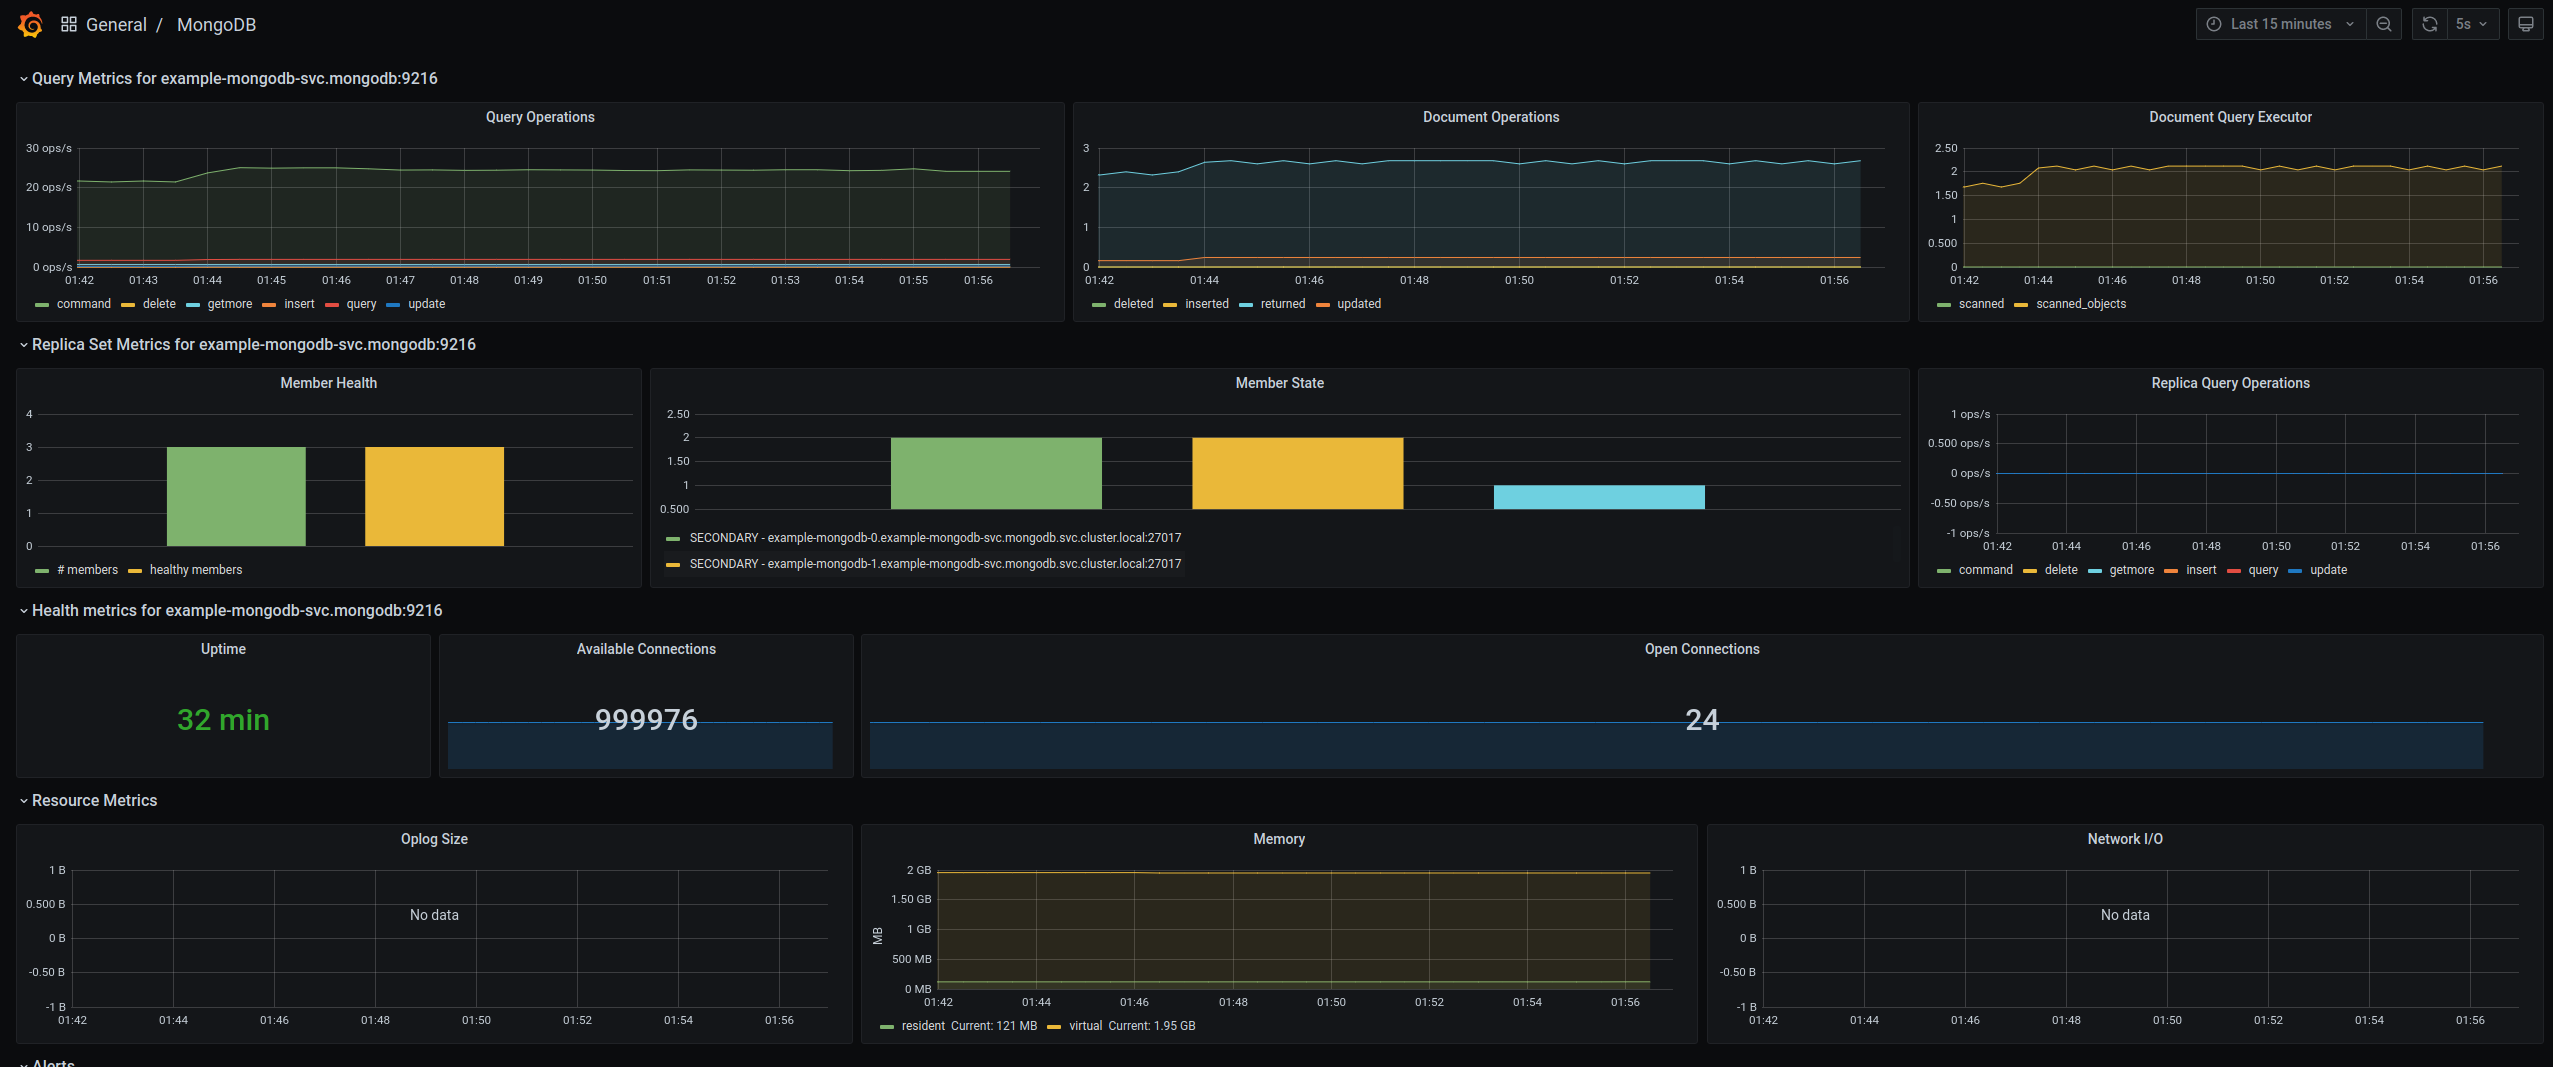
Used Metrics 1515
mongodb_op_counters_total
interval
mongodb_mongod_metrics_document_total
mongodb_mongod_metrics_query_executor_total
mongodb_mongod_replset_number_of_members
mongodb_rs_members_state
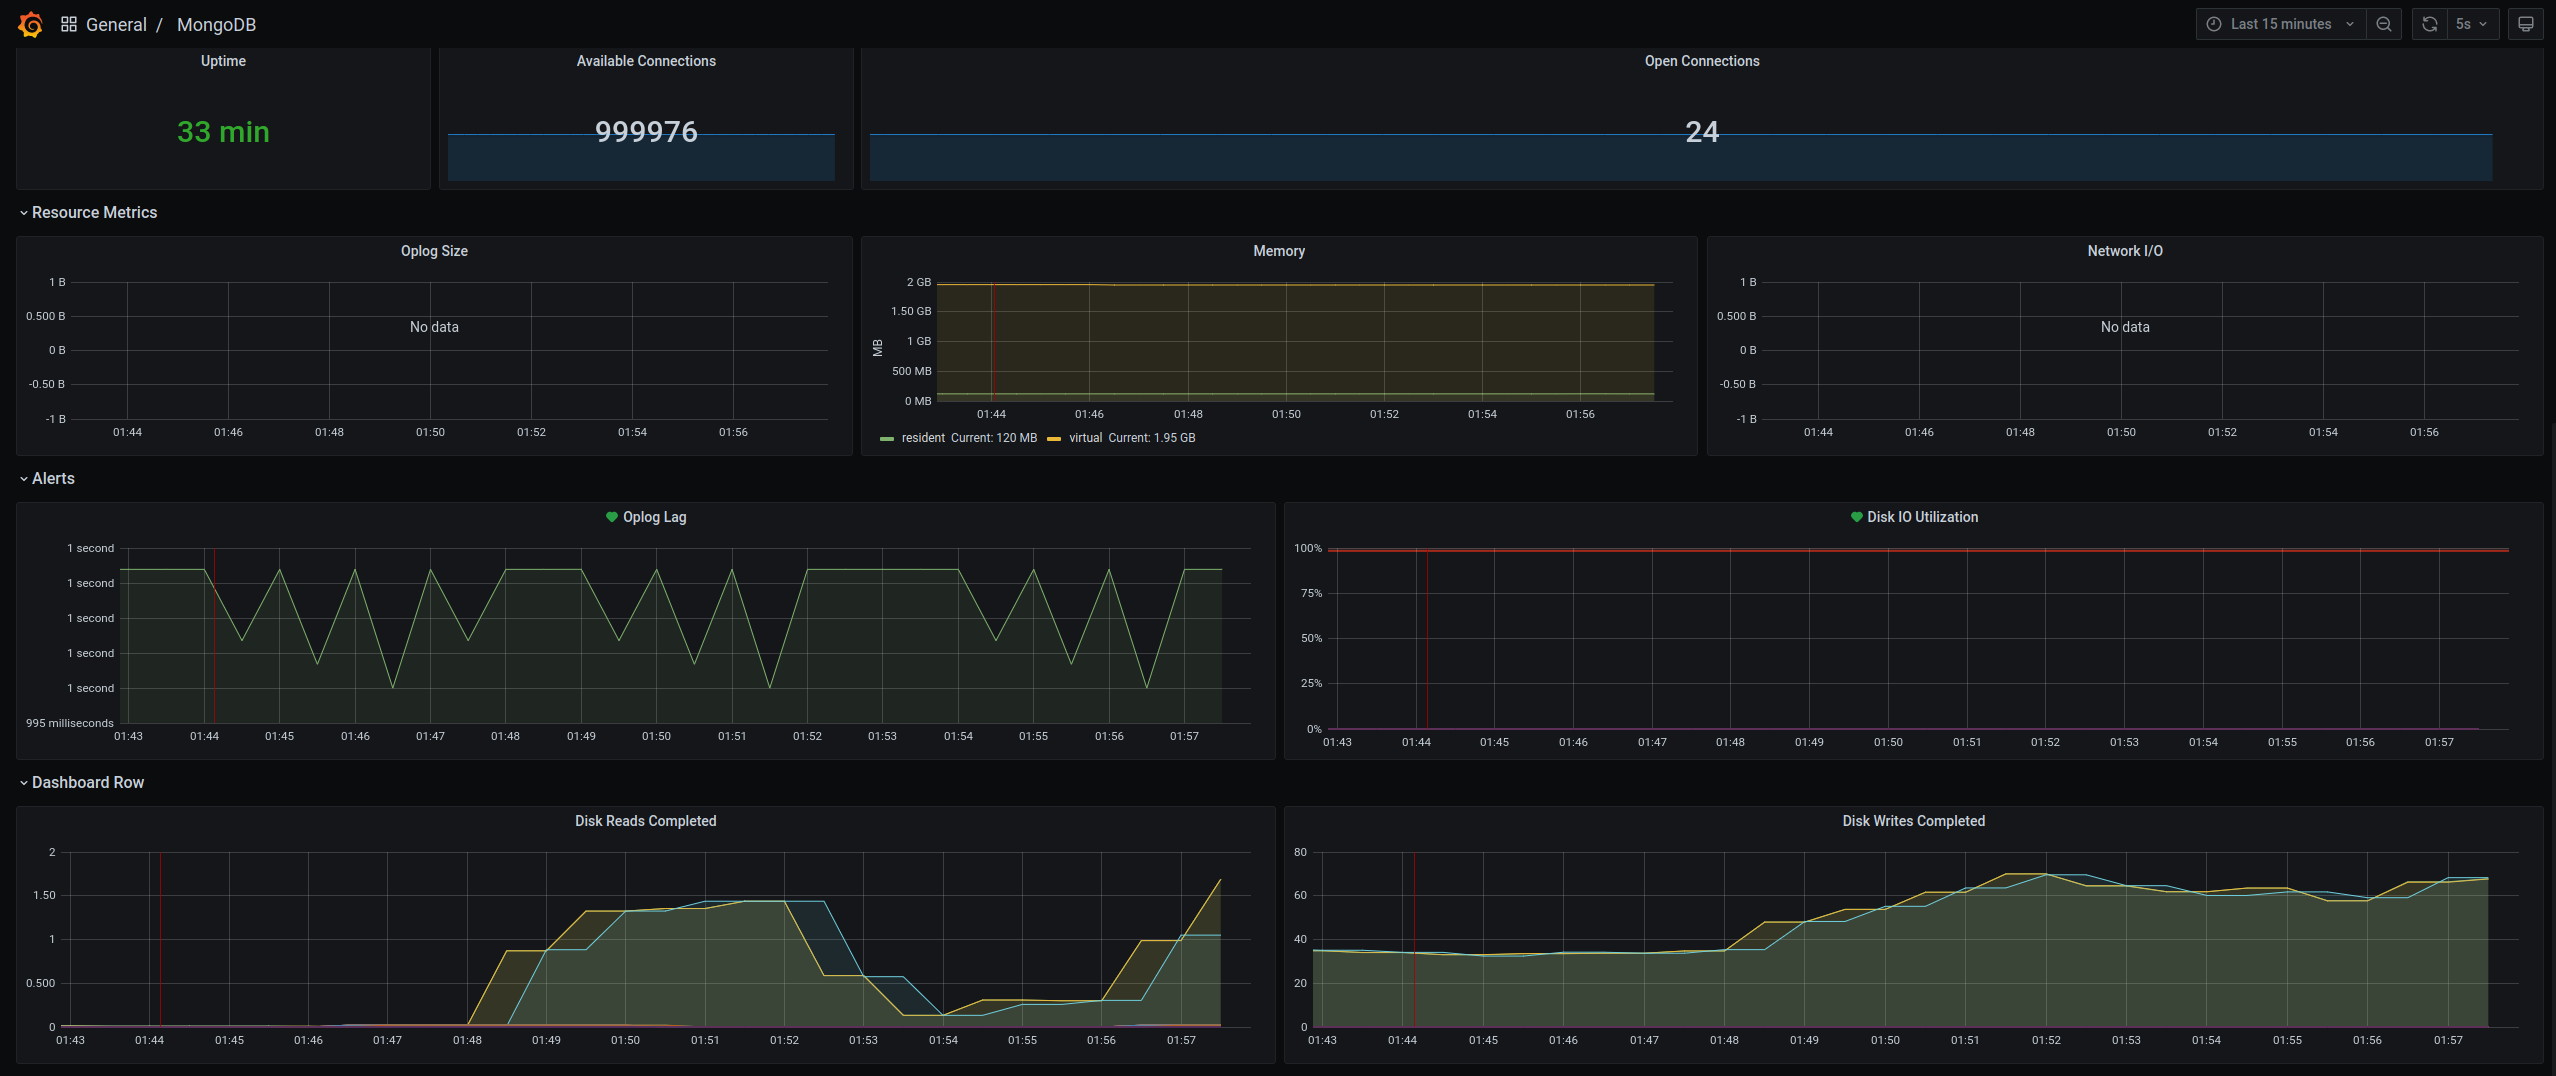
mongodb_instance_uptime_seconds
mongodb_connections
mongodb_oplog_stats_size
mongodb_memory
mongodb_network_metrics_num_requests_total
mongodb_mongod_replset_oplog_head_timestamp
-
node_disk_io_time_seconds_total
-
node_disk_reads_completed_total
-
node_disk_writes_completed_total