Mattermost Performance Monitoring v2 6,4366,436
This dashboard gives a comprehensive overview of the entire Mattermost application. The metrics are divided into 4 sections:
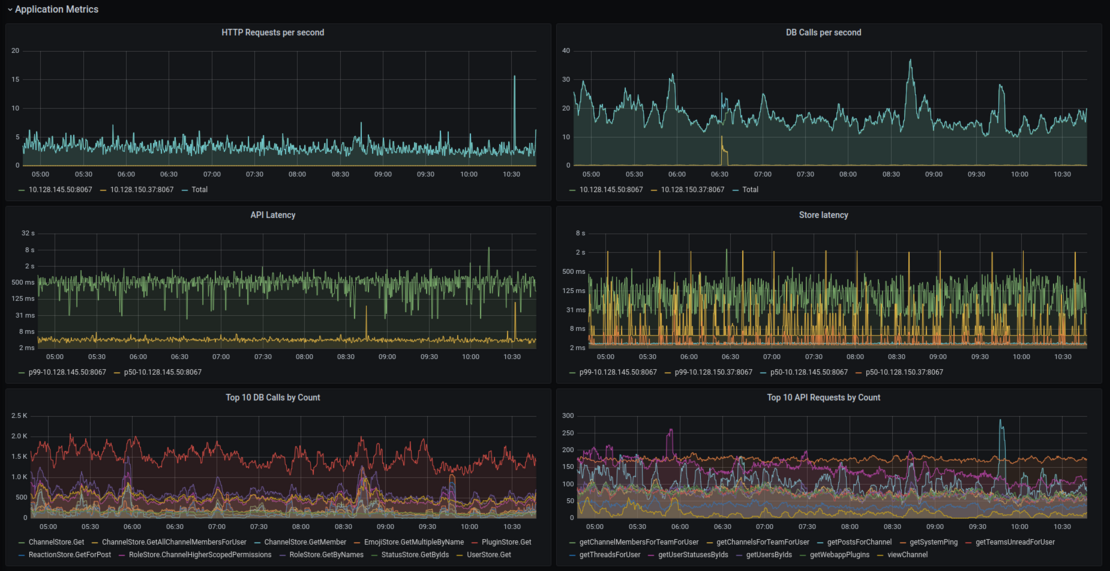
- Application metrics
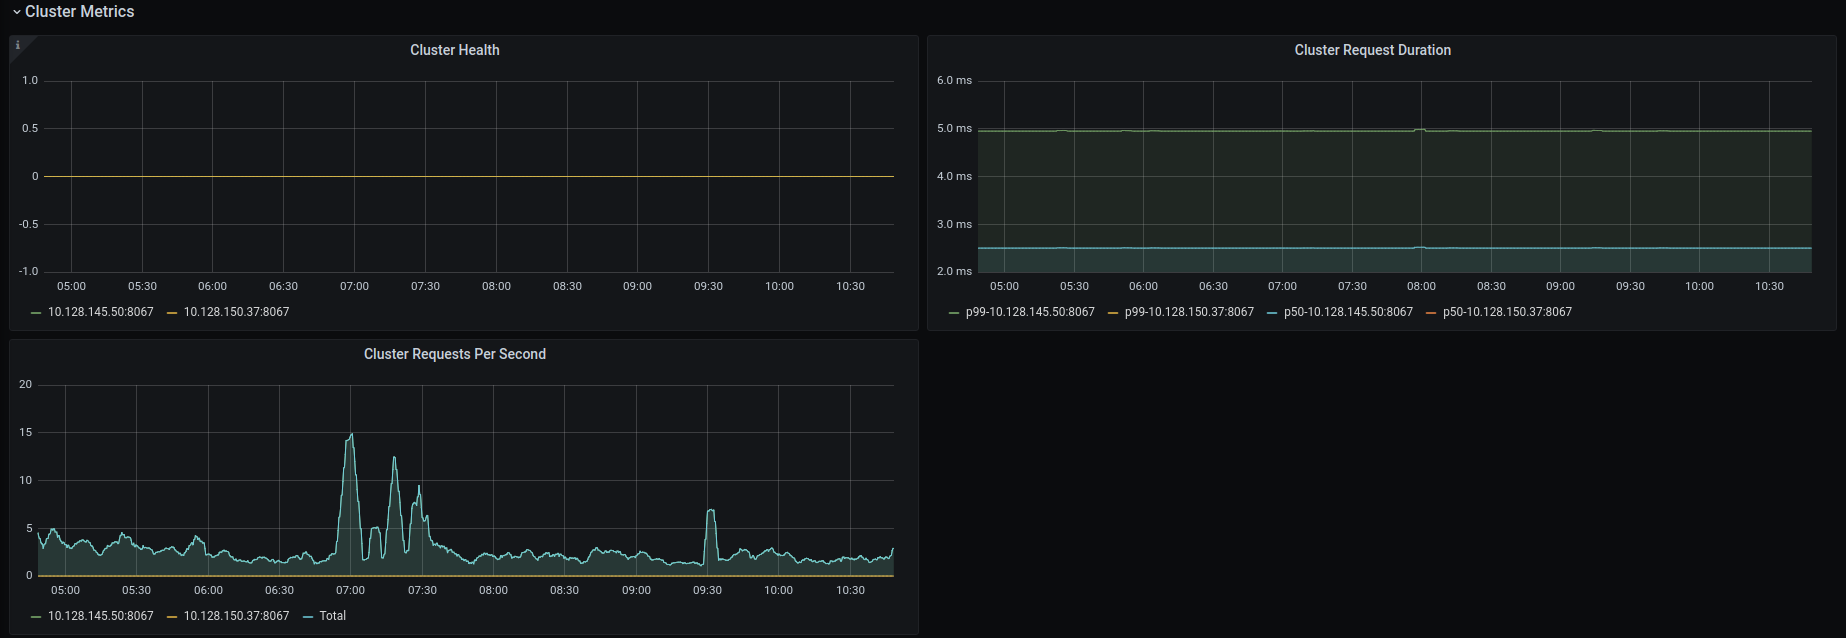
- Cluster metrics
- Job server
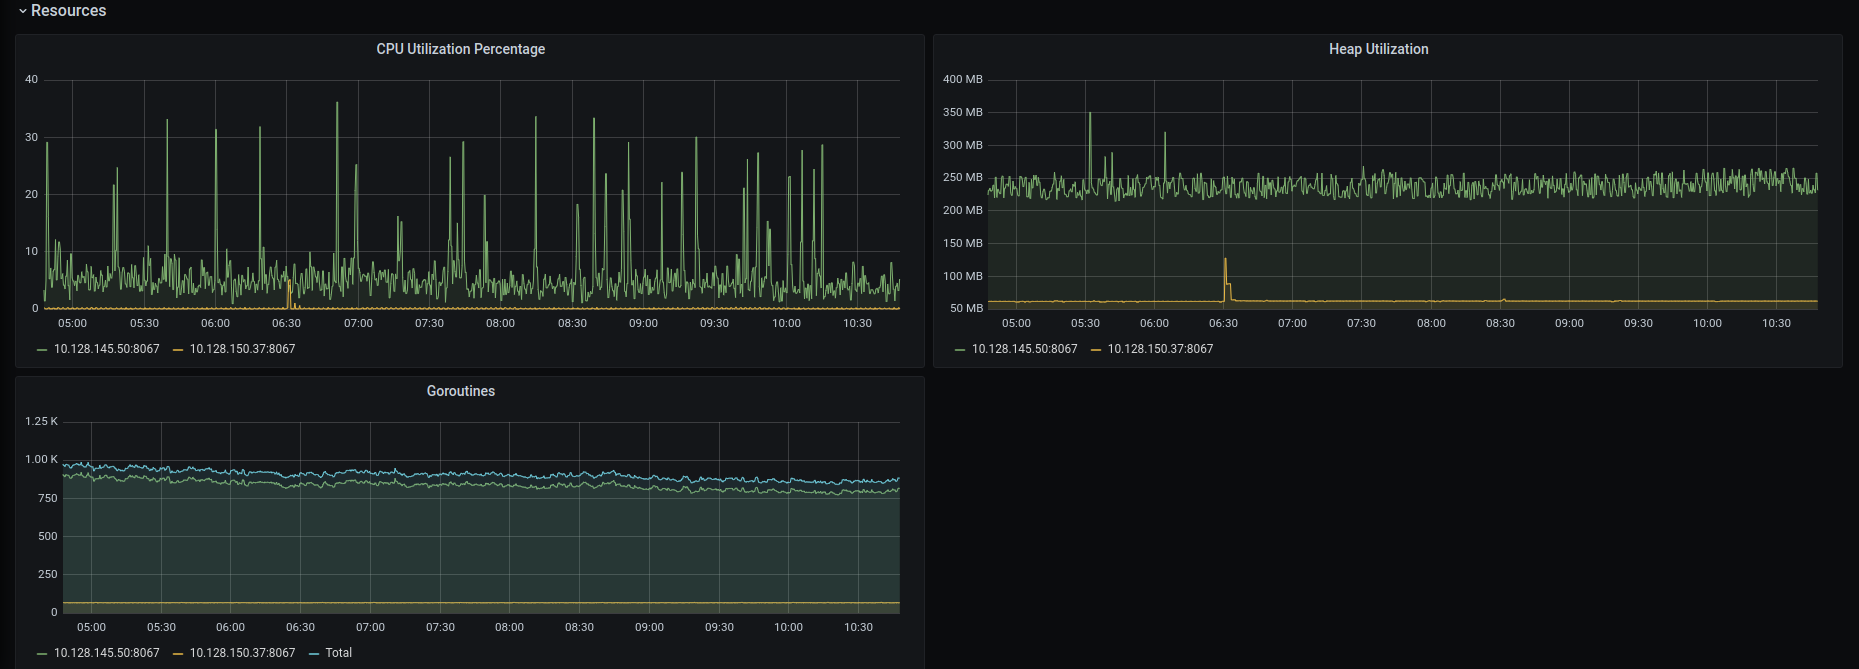
- System metrics
For more information on how to configure Mattermost to collect metrics, visit the Mattermost documentation.
Report issues or feedback in the Mattermost forums or join the discussion in the public Developers Performance channel.
Used Metrics 2727
mattermost_websocket_broadcast_buffer_size
mattermost_websocket_broadcasts_total
mattermost_websocket_reconnects_total
mattermost_websocket_event_total
mattermost_http_requests_total
mattermost_db_store_time_count
mattermost_api_time_bucket
mattermost_db_store_time_bucket
mattermost_api_time_count
mattermost_db_store_time_sum
mattermost_api_time_sum
mattermost_http_websockets_total
mattermost_db_master_connections_total
mattermost_db_read_replica_connections_total
go_sql_open_connections
go_sql_in_use_connections
go_sql_wait_count_total
go_sql_max_idle_closed_total
go_sql_max_idle_time_closed_total
mattermost_db_replica_lag_time
mattermost_cluster_cluster_health_score
mattermost_cluster_cluster_request_duration_seconds_bucket
mattermost_cluster_cluster_request_duration_seconds_count
mattermost_jobs_active
mattermost_process_cpu_seconds_total
-
go_memstats_heap_inuse_bytes
-
go_goroutines