Docker monitoring 6,8666,866 5.0 (1 reviews)
2/23/2022
7/12/2025
13
Docker
>=12.1.0-89781.patch2-90617
Prometheus
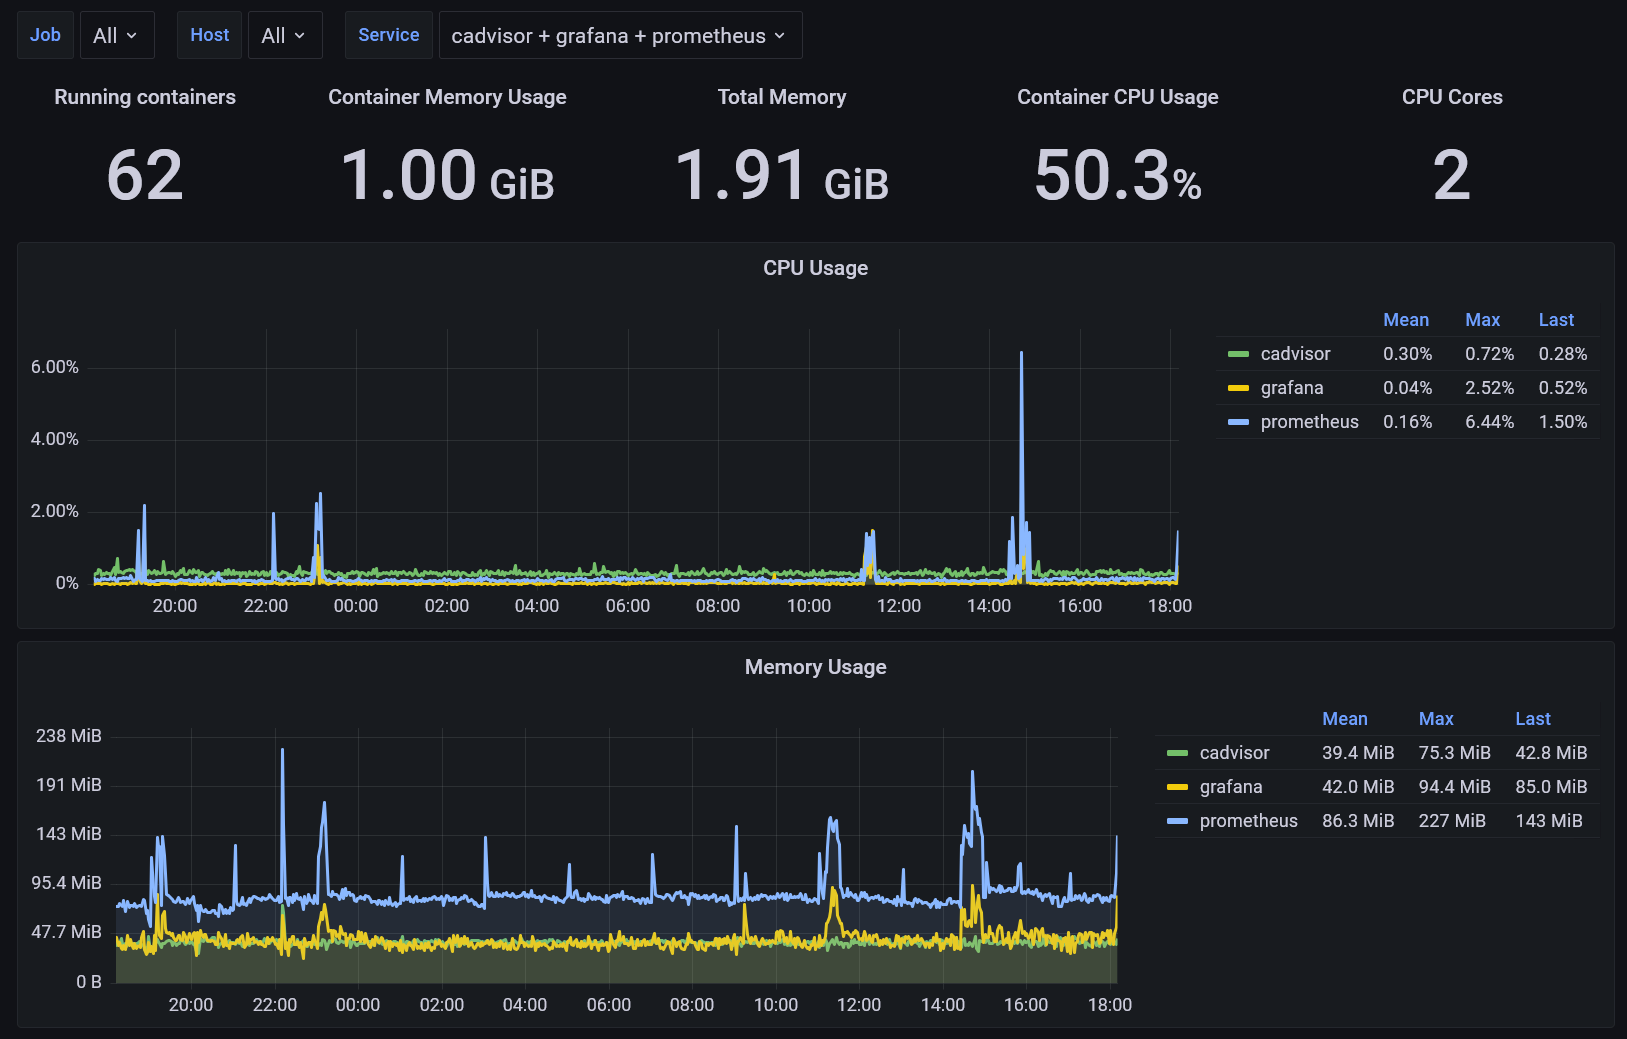
This is a dashboard for monitoring Docker container metrics collected by cAdvisor and stored in Prometheus TSDB.
Features:
- Depend on only cAdvisor metrics.
- Select Jobs, Nodes and Services. Multi-value and Select-all are supported.
- Use the new Time series panel. Faster
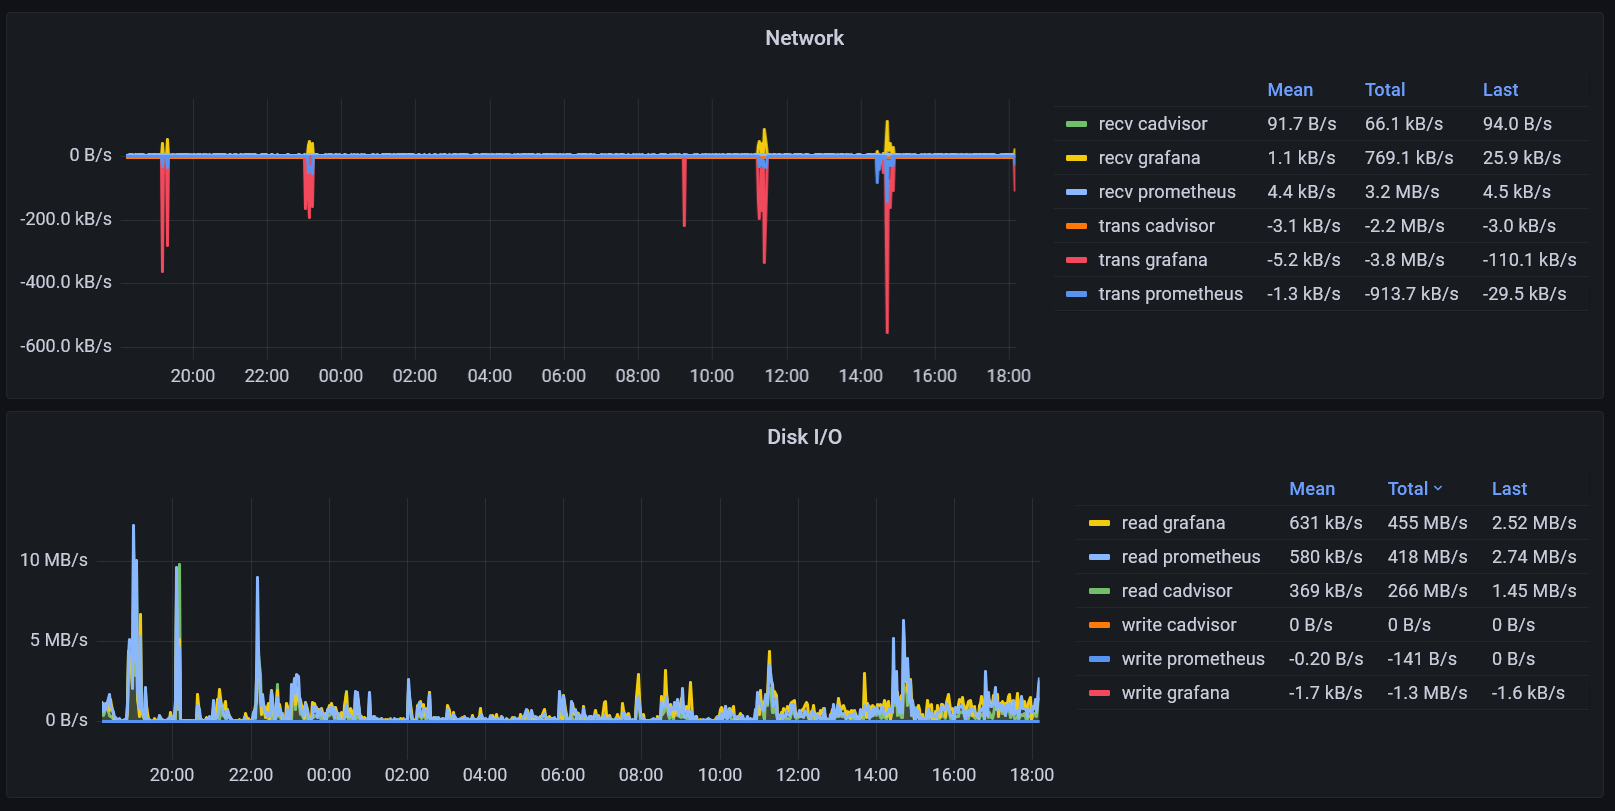
- Merge network transmit and receive into one longer panel.
- Merge Disk read and write into one longer panel.
This dashboard use the following metrics and their corresponding cadvisor model:
container_cpu_user_seconds_total: cpucontainer_memory_usage_bytes: memorycontainer_network_receive_bytes_total: networkcontainer_network_transmit_bytes_total: networkcontainer_fs_reads_bytes_total: diskIOcontainer_fs_writes_bytes_total: diskIO
This dashboard expects the following labels on the metrics:
jobservicenodecontainer
You may assign container_label_com_docker_swarm_service_name to service, and name to container using Prometheus' metric_relabel_configs. Here is an example of the scrape rules.
metric_relabel_configs:
      - source_labels: ['container_label_com_docker_swarm_service_name']
        target_label: 'service'
      - source_labels: ['name']
        target_label: 'container'
You can add container_label_com_docker_swarm_service_name to the container by setting allowlisted_container_labels: ['com.docker.swarm.service.name'] for the cadvisor.
Export Dashboard✕
Download
Copy to Clipboard