EKS Cluster 4,9364,936
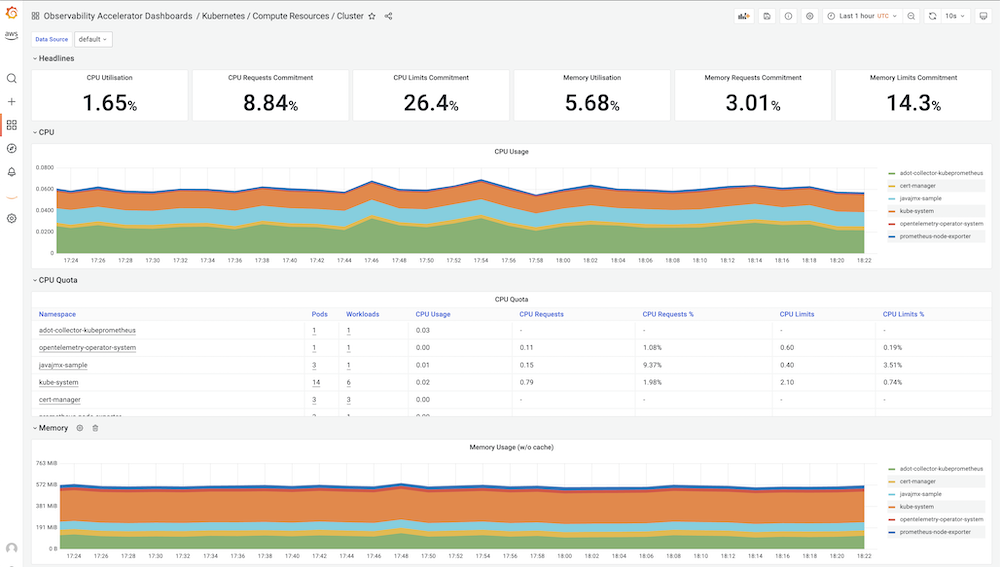
This dashboard is part of the AWS Observability Accelerator and enables you to monitor EKS clusters based on Prometheus metrics.
For an automated end-to-end setup based on Terraform as well as to provide feedback or report an issue with the dashboard, please visit the AWS Observability Accelerator GitHub repo.
Used Metrics 2222
cluster:node_cpu:ratio_rate
namespace_cpu:kube_pod_container_resource_requests:sum
kube_node_status_allocatable
namespace_cpu:kube_pod_container_resource_limits:sum
:node_memory_MemAvailable_bytes:sum
-
node_memory_MemTotal_bytes
namespace_memory:kube_pod_container_resource_requests:sum
namespace_memory:kube_pod_container_resource_limits:sum
node_namespace_pod_container:container_cpu_usage_seconds_total:sum_irate
kube_pod_owner
namespace_workload_pod:kube_pod_owner:relabel
-
container_memory_rss
-
container_network_receive_bytes_total
-
container_network_transmit_bytes_total
-
container_network_receive_packets_total
-
container_network_transmit_packets_total
-
container_network_receive_packets_dropped_total
-
container_network_transmit_packets_dropped_total
-
container_fs_reads_total
-
container_fs_writes_total
-
container_fs_reads_bytes_total
-
container_fs_writes_bytes_total