EKS Node Exporter 2,3142,314
10/28/2022
10/28/2022
1
AWS
>=8.4.7
Prometheus
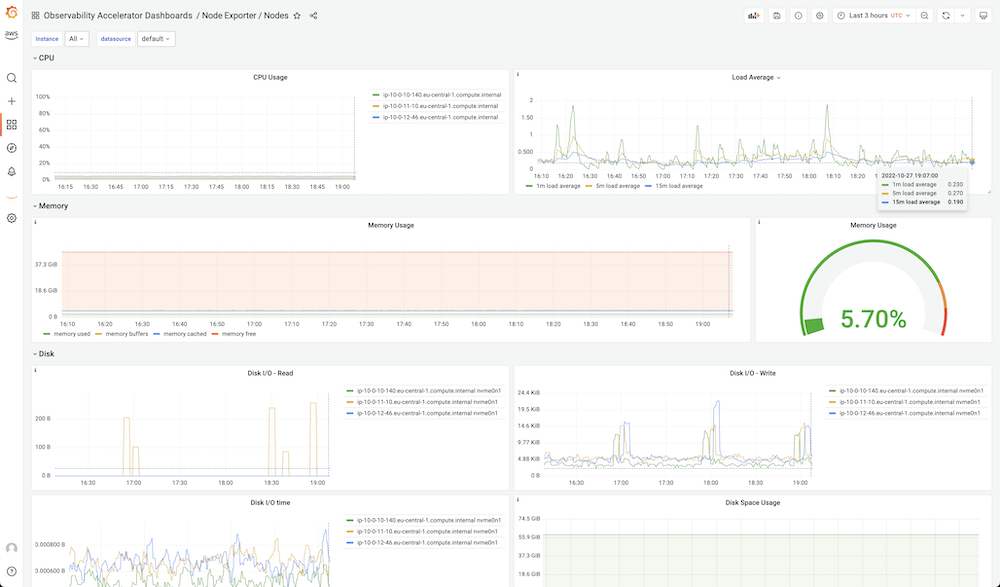
This dashboard is part of the AWS Observability Accelerator and enables you to monitor EKS nodes based on Prometheus metrics from the Node Exporter.
For an automated end-to-end setup based on Terraform as well as to provide feedback or report an issue with the dashboard, please visit the AWS Observability Accelerator GitHub repo.
Export Dashboard✕
Download
Copy to Clipboard
Used Metrics 1616
-
node_cpu_seconds_total
-
node_load1
-
node_load5
-
node_load15
-
node_memory_MemTotal_bytes
-
node_memory_MemFree_bytes
-
node_memory_Buffers_bytes
-
node_memory_Cached_bytes
-
node_memory_MemAvailable_bytes
-
node_disk_read_bytes_total
-
node_disk_written_bytes_total
-
node_disk_io_time_seconds_total
-
node_filesystem_size_bytes
-
node_filesystem_avail_bytes
-
node_network_receive_bytes_total
-
node_network_transmit_bytes_total