Redis Overview 874874
11/14/2022
11/14/2022
1
Web Servers
>=9.1.5
Prometheus
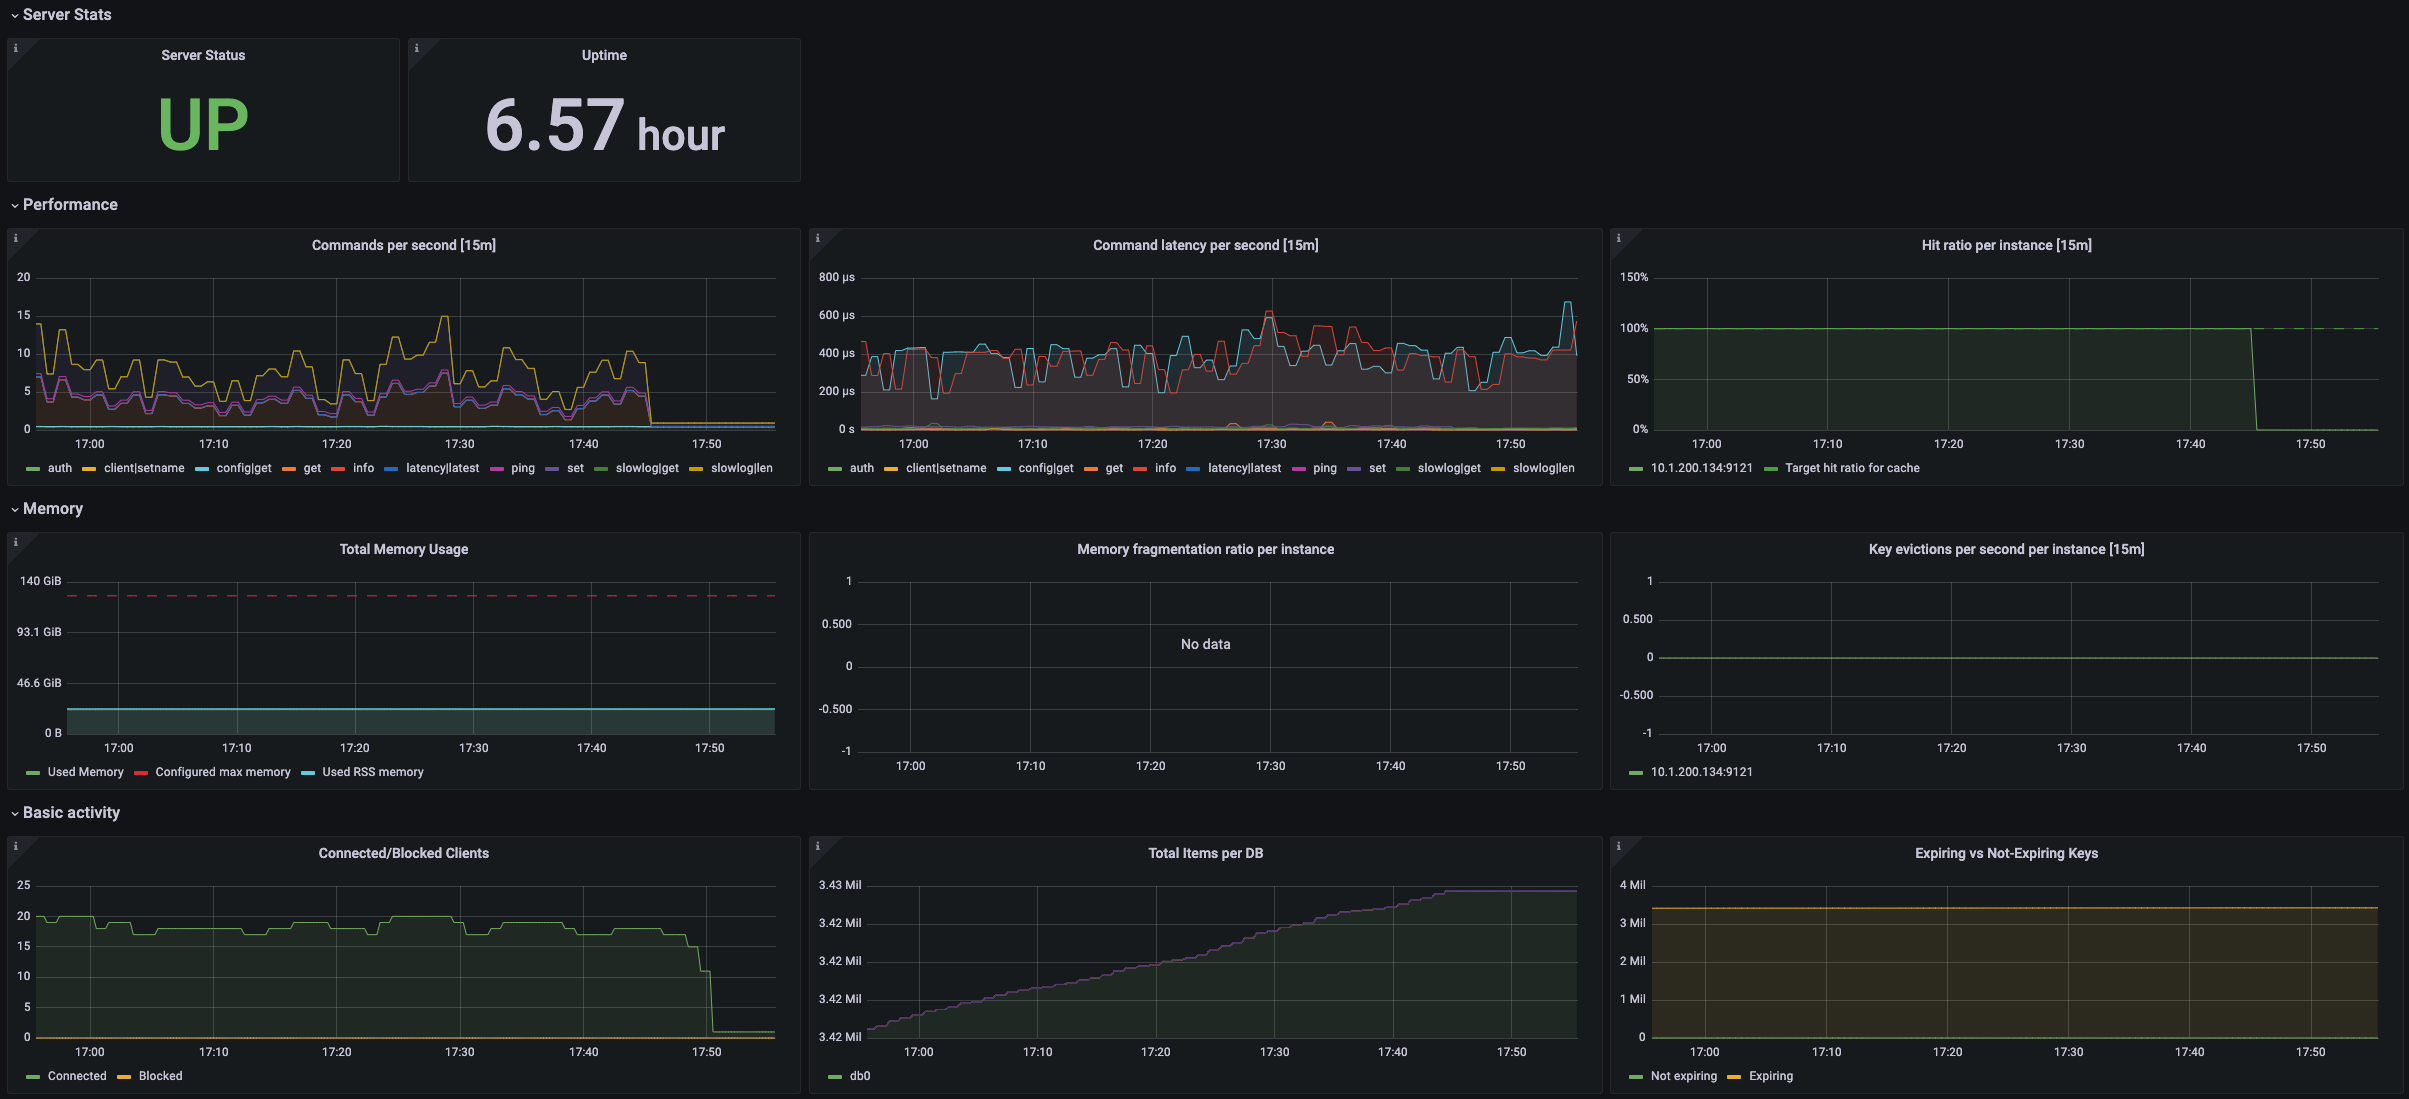
Custom Redis Node Exporter dashboard for Grafana that displays:
- Server Statiscs: Uptime
- Basic Activity
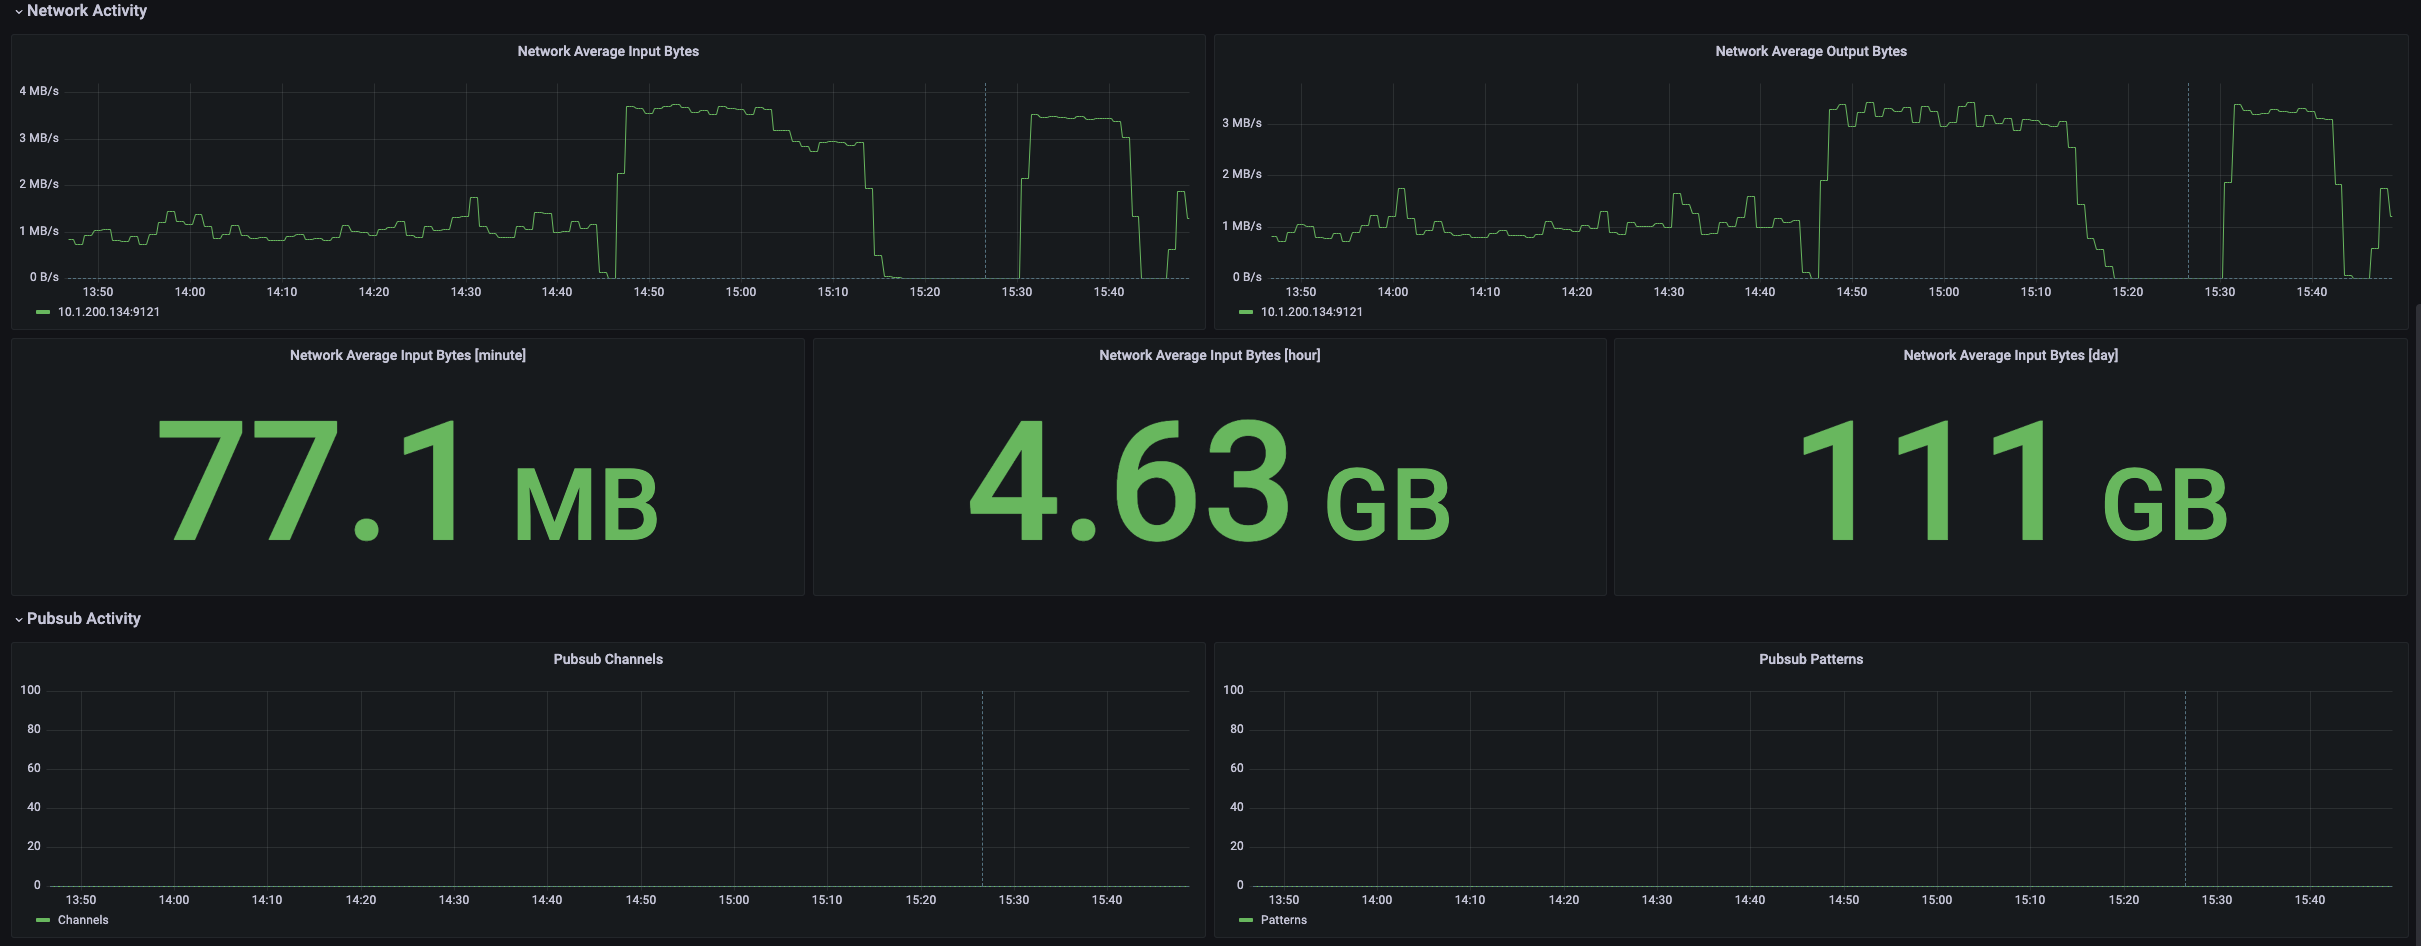
- Pubsub activity
- Network Activity
- Performance
- Memory
Export Dashboard✕
Download
Copy to Clipboard
Used Metrics 2323
-
redis_up
-
redis_uptime_in_seconds
-
redis_commands_total
-
redis_commands_duration_seconds_total
-
redis_keyspace_hits_total
-
redis_keyspace_misses_total
-
redis_memory_used_bytes
-
redis_memory_max_bytes
-
redis_memory_used_rss_bytes
redis_memory_fragmentation_ratio
-
redis_evicted_keys_total
-
redis_connected_clients
-
redis_blocked_clients
-
redis_db_keys
-
redis_db_keys_expiring
-
redis_connected_slaves
redis_master_last_io_seconds_ago
redis_total_writes_processed
redis_total_reads_processed
-
redis_net_input_bytes_total
-
redis_net_output_bytes_total
-
redis_pubsub_channels
-
redis_pubsub_patterns