Cluster overview 47,78847,788
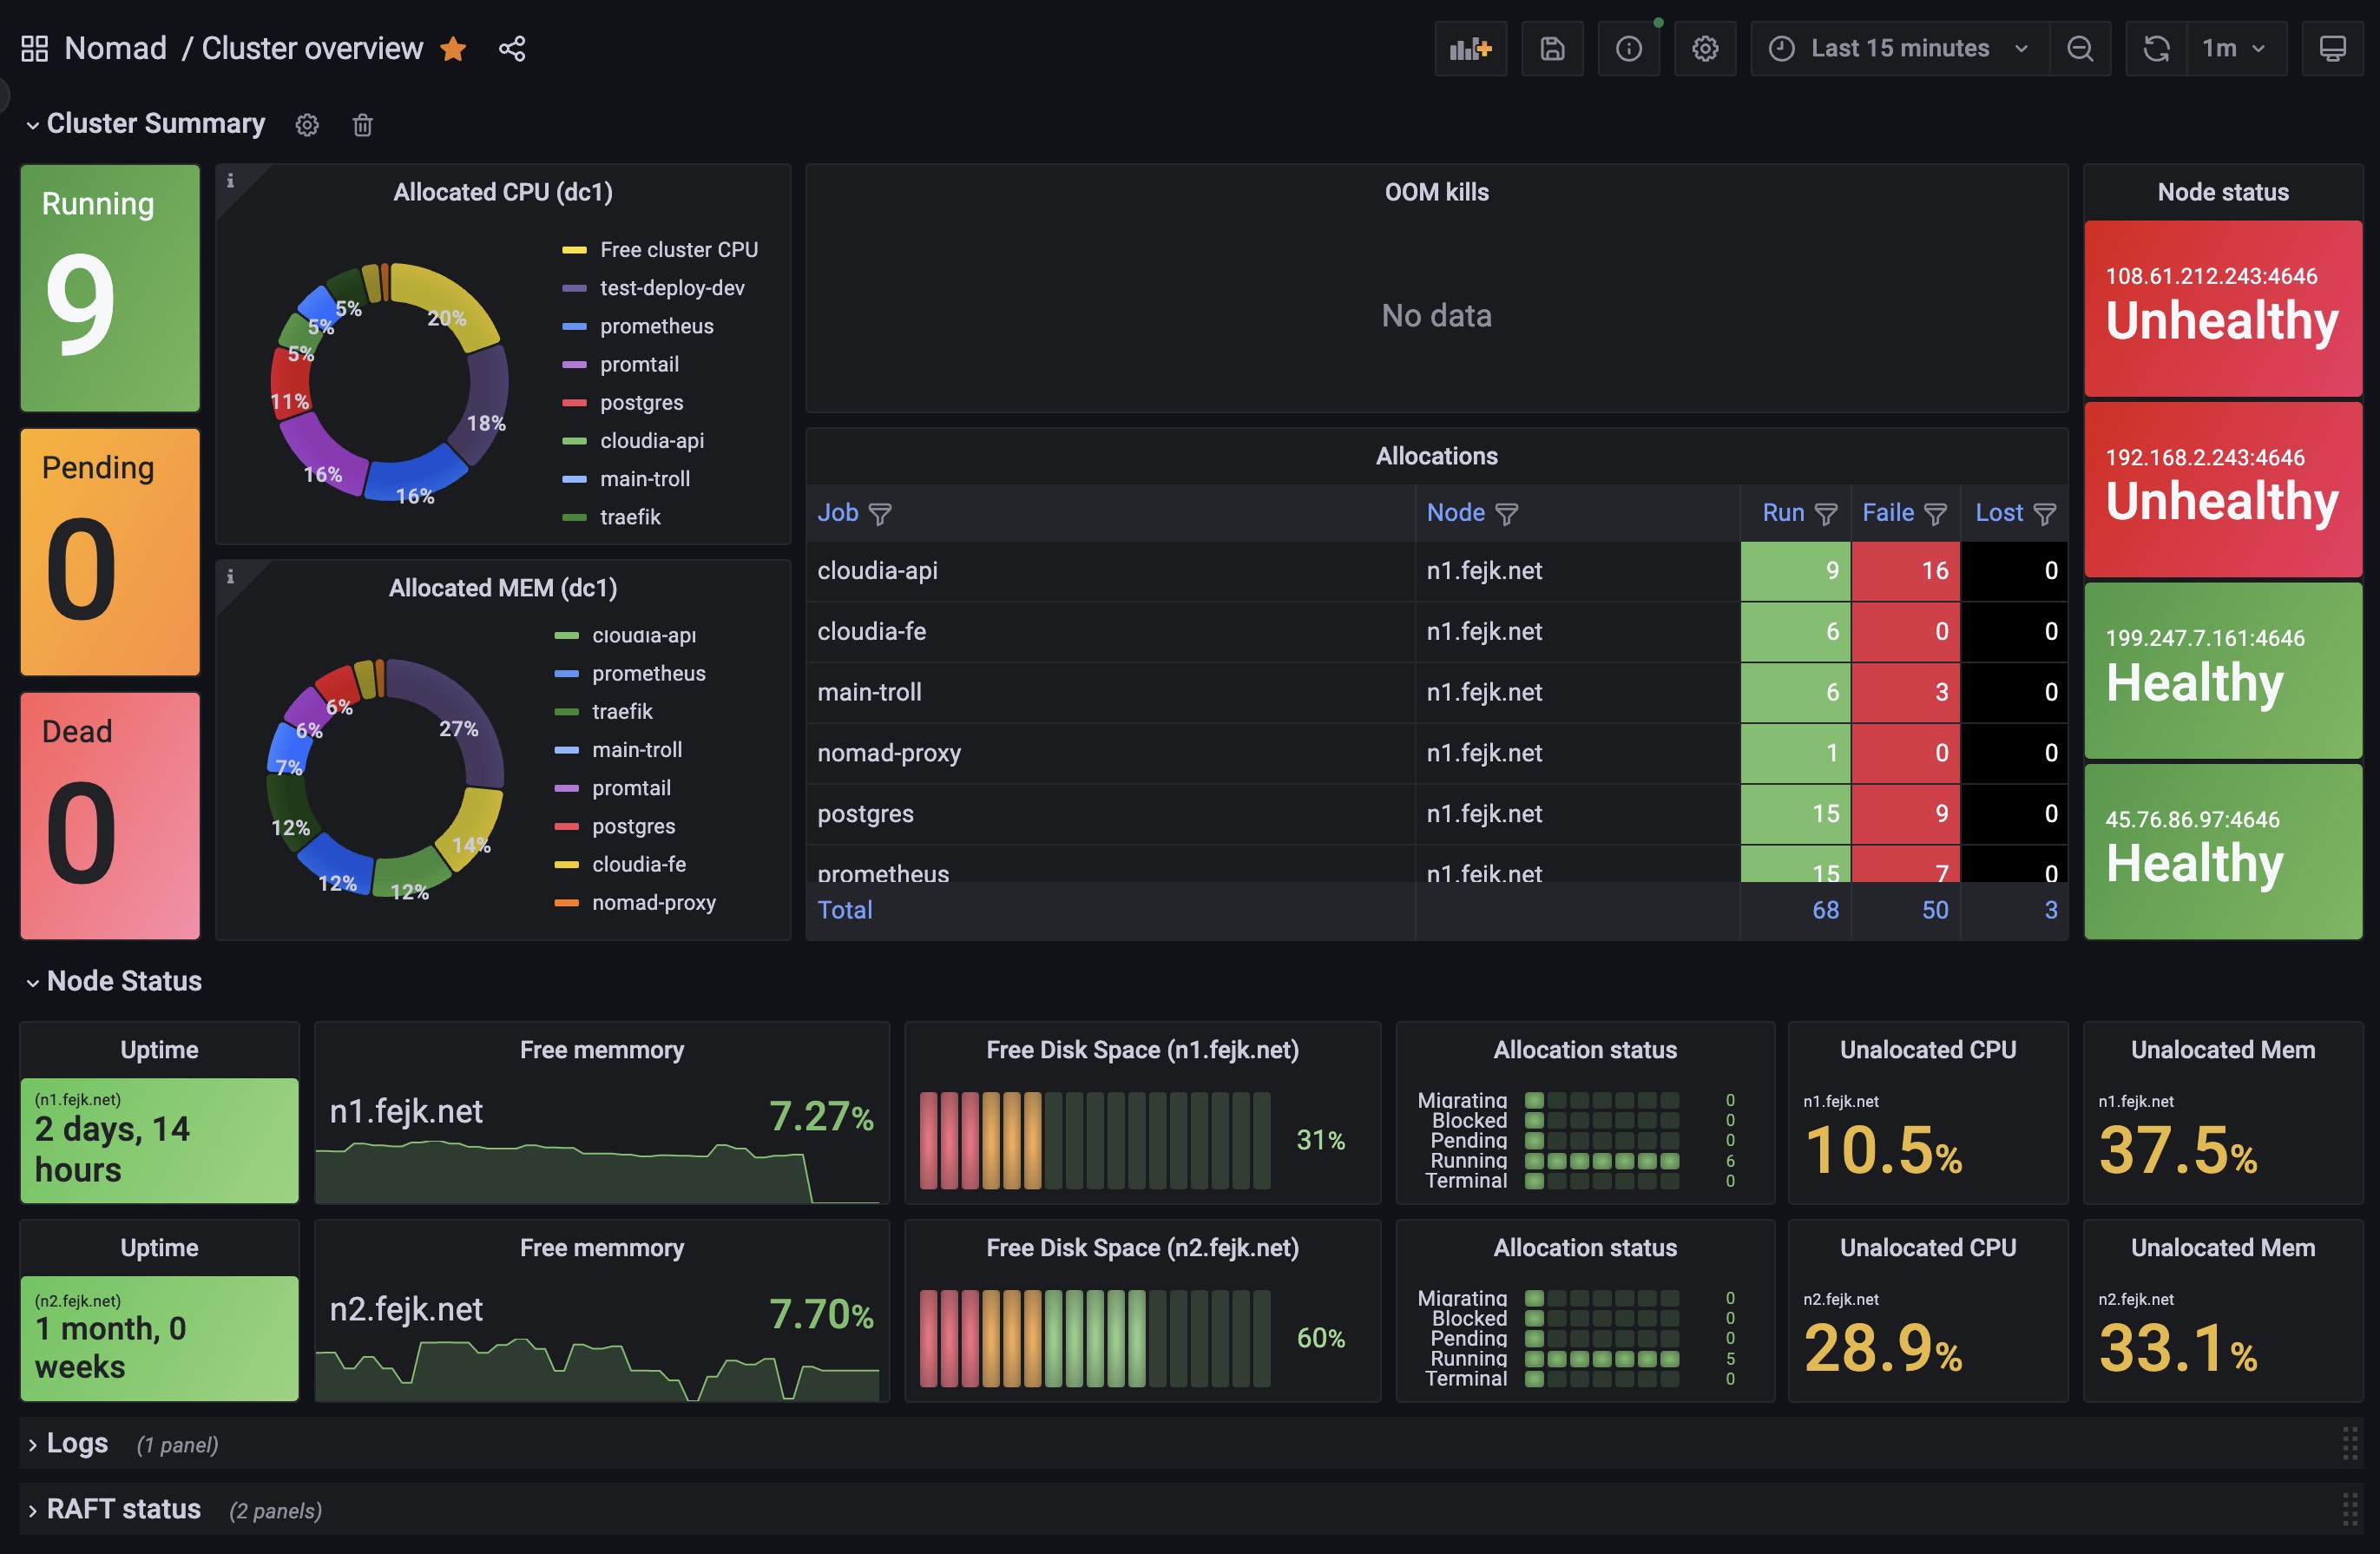
Example nomad cluster dashboard
Monitored example cluster with example promtail, loki and prometheus configuration is live there https://github.com/theztd/startup-infra-docker
I will be happy for the feedback
Used Metrics 2828
nomad_nomad_job_status_running
nomad_client_allocs_cpu_allocated
nomad_client_unallocated_cpu
nomad_client_allocs_oom_killed
timestamp
-
up
nomad_nomad_job_status_pending
nomad_nomad_job_summary_complete
nomad_nomad_job_summary_failed
nomad_nomad_job_summary_lost
nomad_nomad_job_summary_starting
nomad_nomad_job_summary_queued
nomad_nomad_job_summary_running
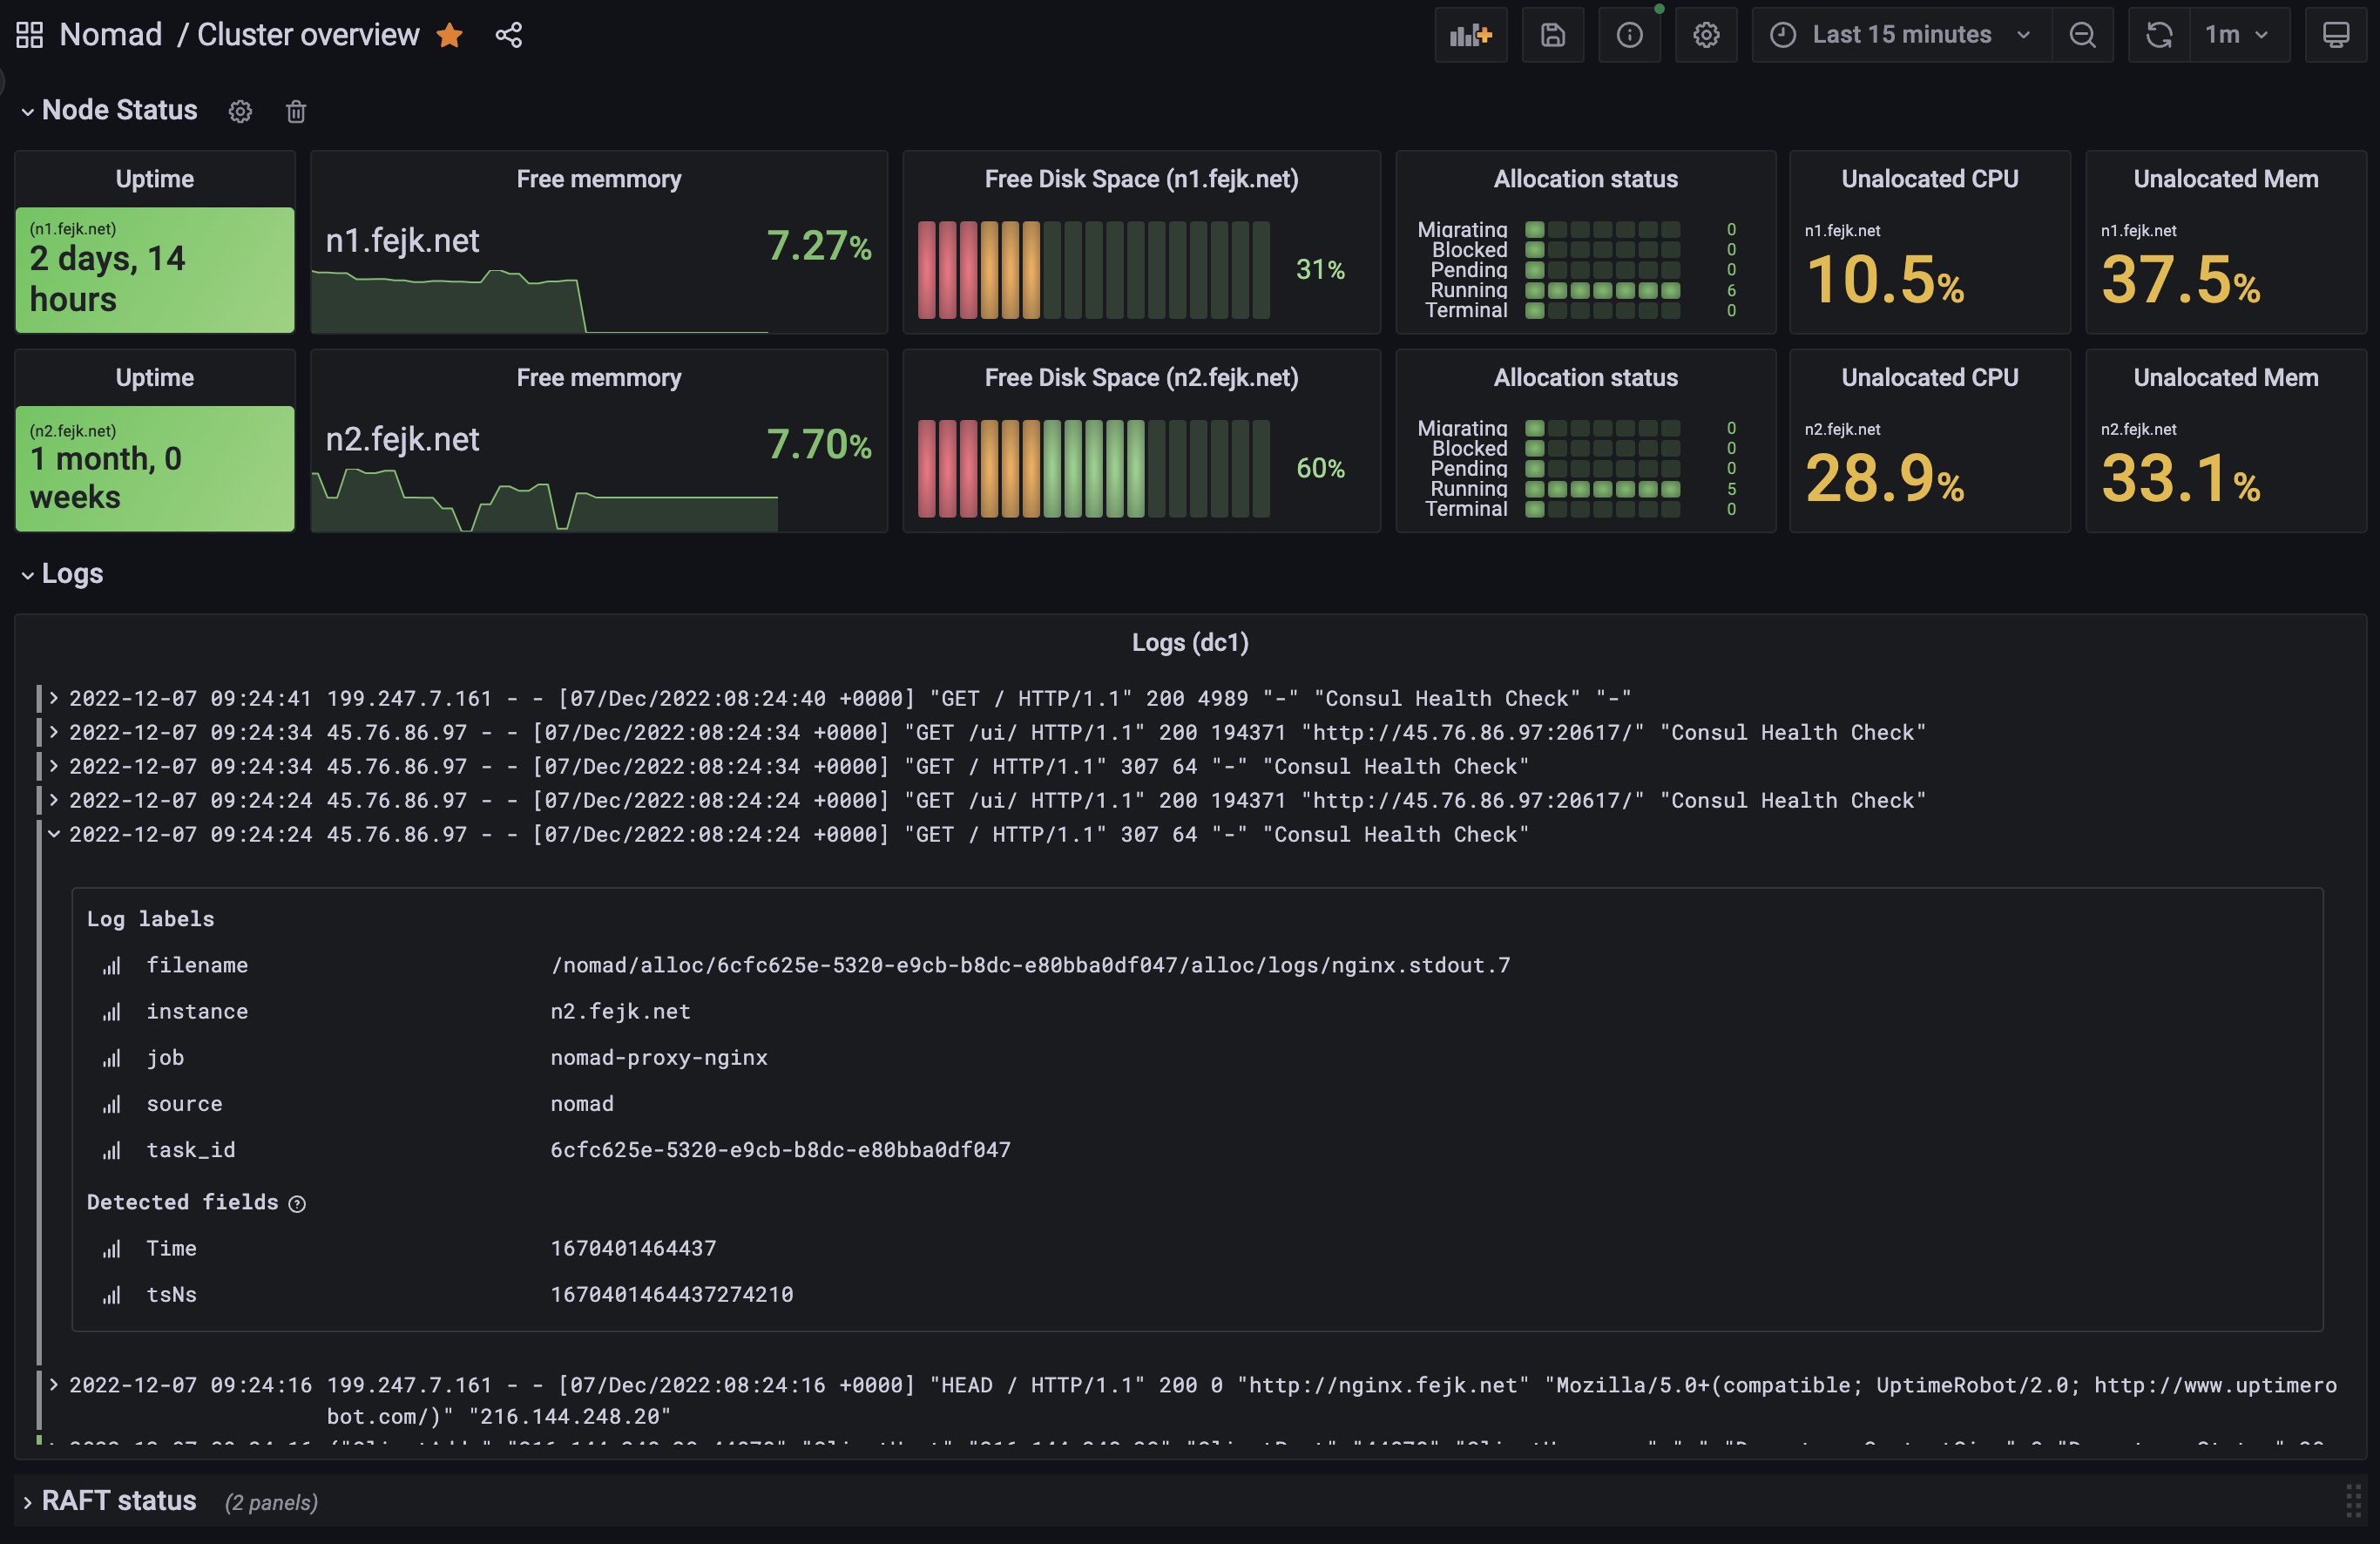
nomad_client_allocs_memory_allocated
nomad_client_host_memory_free
nomad_nomad_job_status_dead
nomad_client_uptime
nomad_client_host_memory_total
nomad_client_host_disk_available
nomad_client_host_disk_size
nomad_client_allocations_migrating
nomad_client_allocations_blocked
nomad_client_allocations_pending
nomad_client_allocations_running
nomad_client_allocations_terminal
nomad_client_allocated_cpu
nomad_client_unallocated_memory
nomad_client_allocated_memory