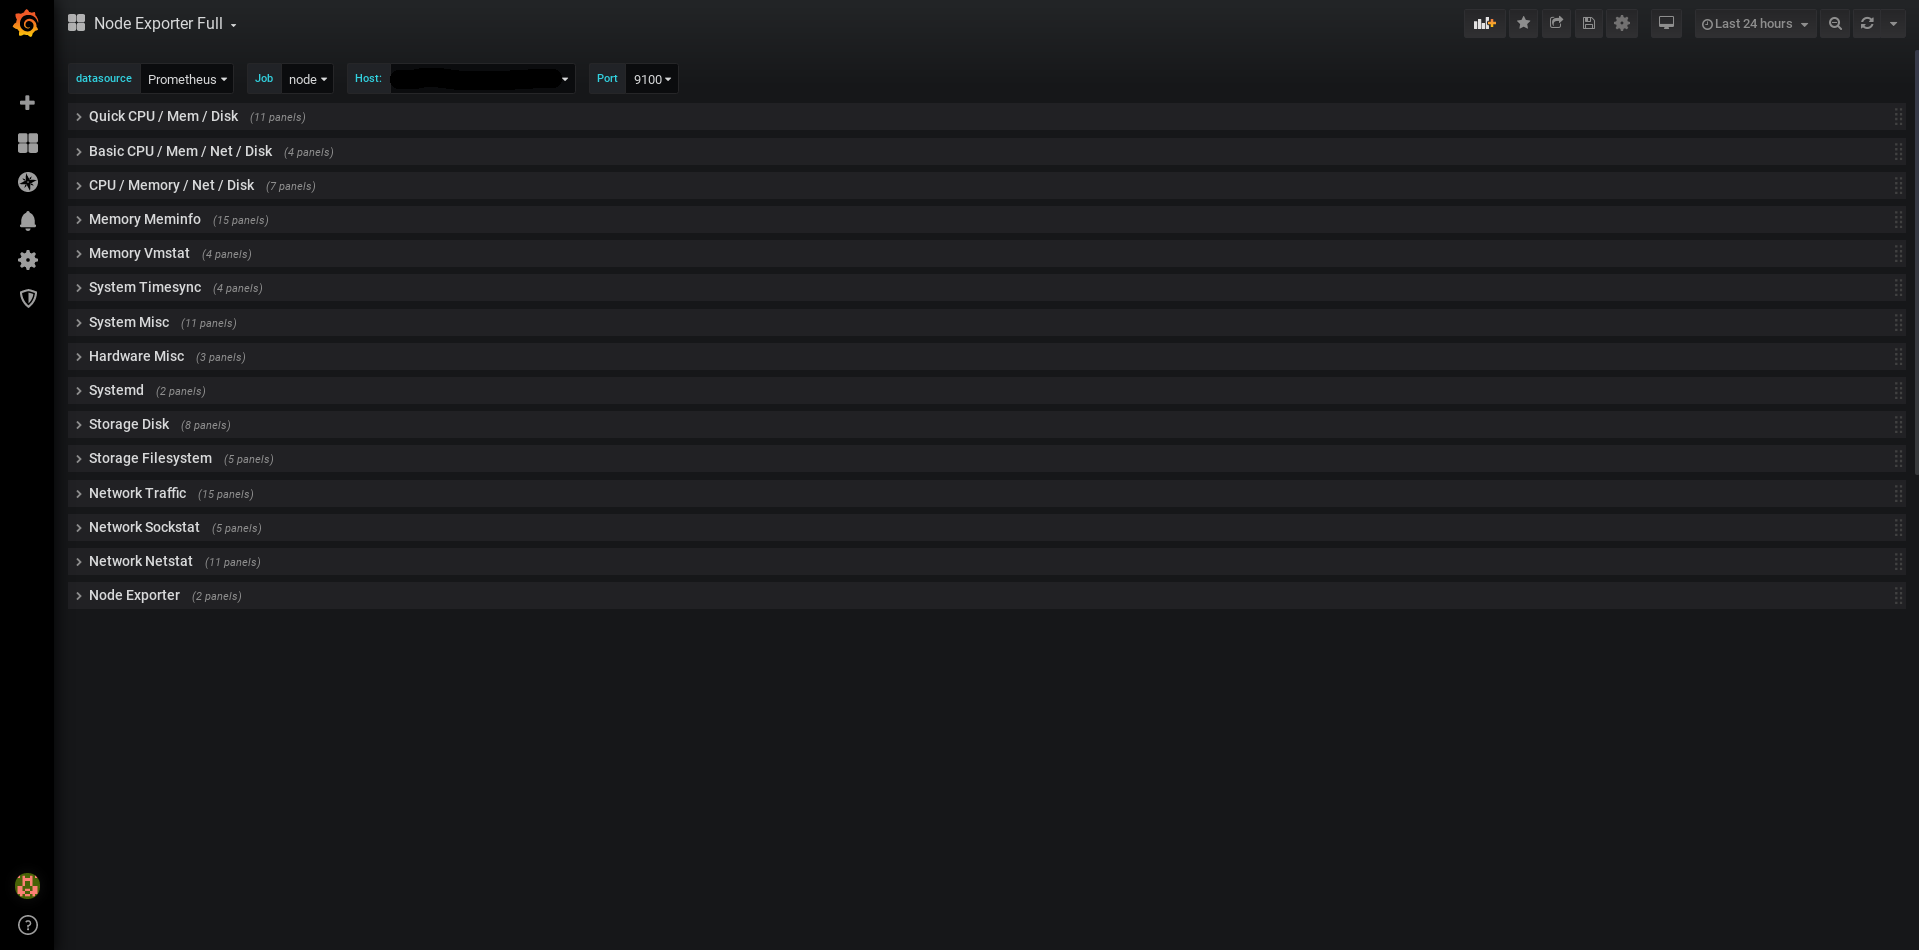
Node Exporter Full 116,633,309116,633,309 4.9 (78 reviews)
Nearly all default values exported by Prometheus node exporter graphed.
Only requires the default job_name: node, add as many targets as you need in '/etc/prometheus/prometheus.yml'.
  - job_name: node
    static_configs:
      - targets: ['localhost:9100']
Recommended for prometheus-node-exporter the arguments '--collector.systemd --collector.processes' because the graph uses some of their metrics.
Since revision 16, for prometheus-node-exporter v0.18 or newer. Since revision 12, for prometheus-node-exporter v0.16 or newer.
Available on github: https://github.com/rfmoz/grafana-dashboards.git
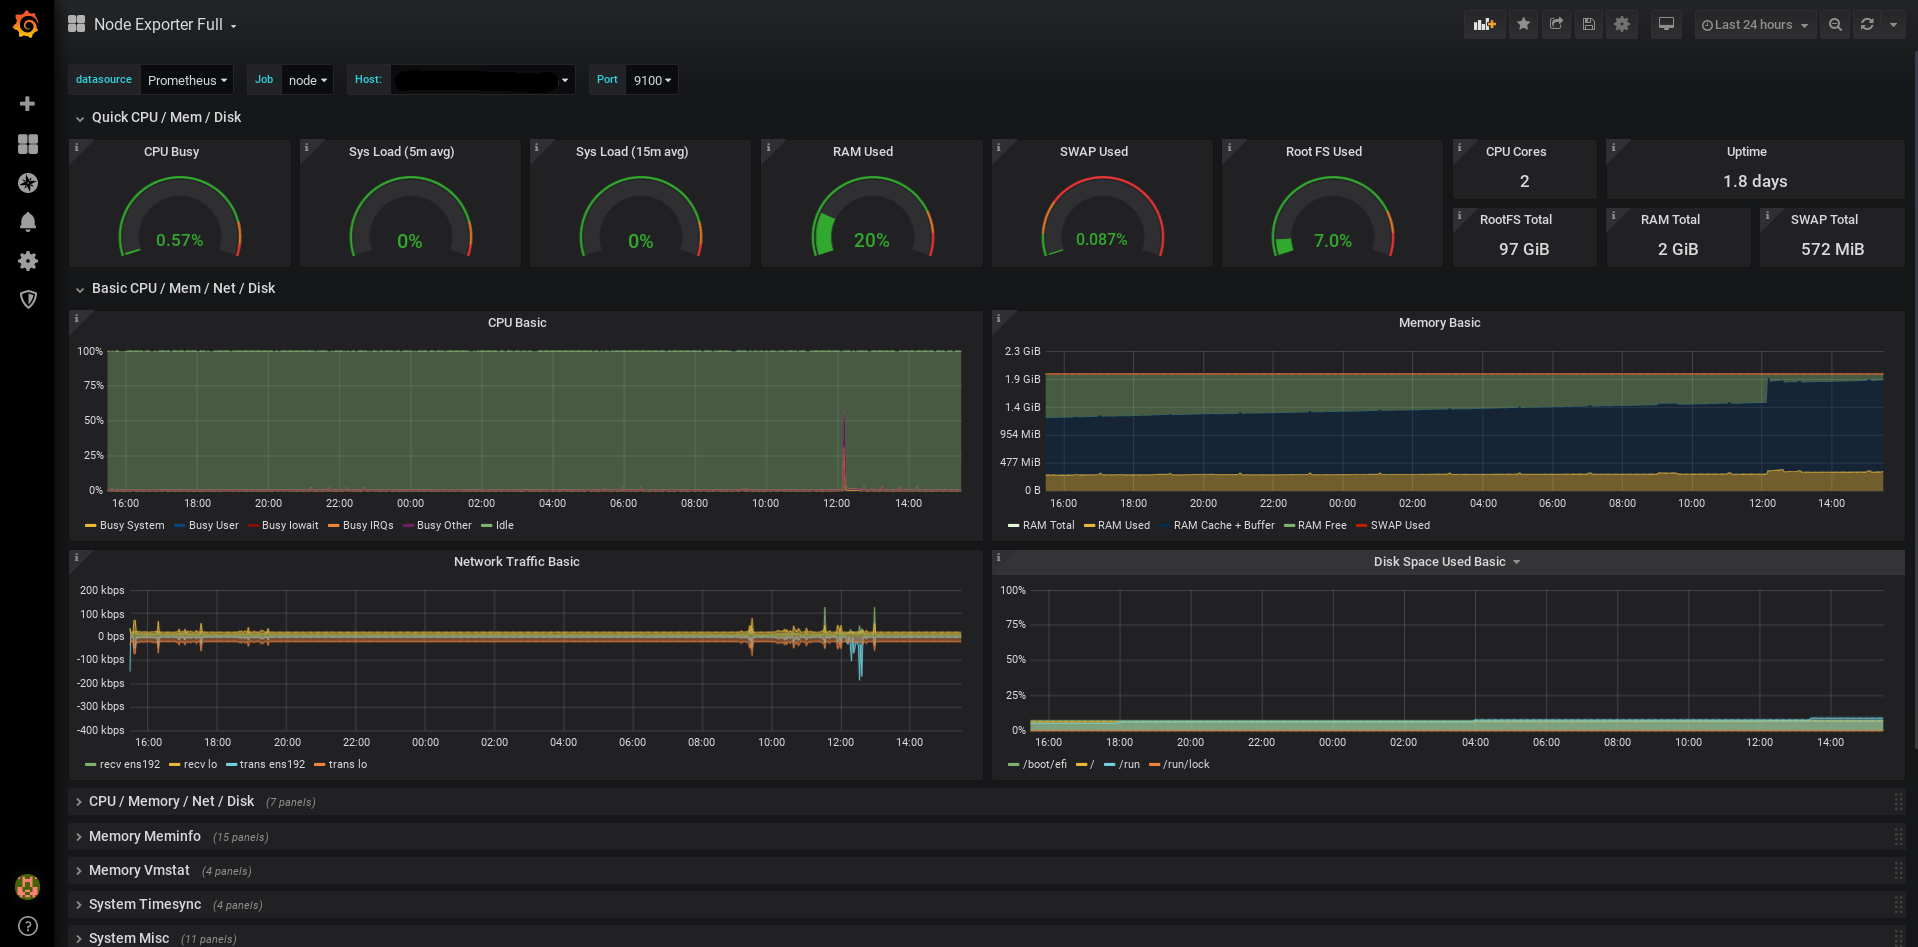
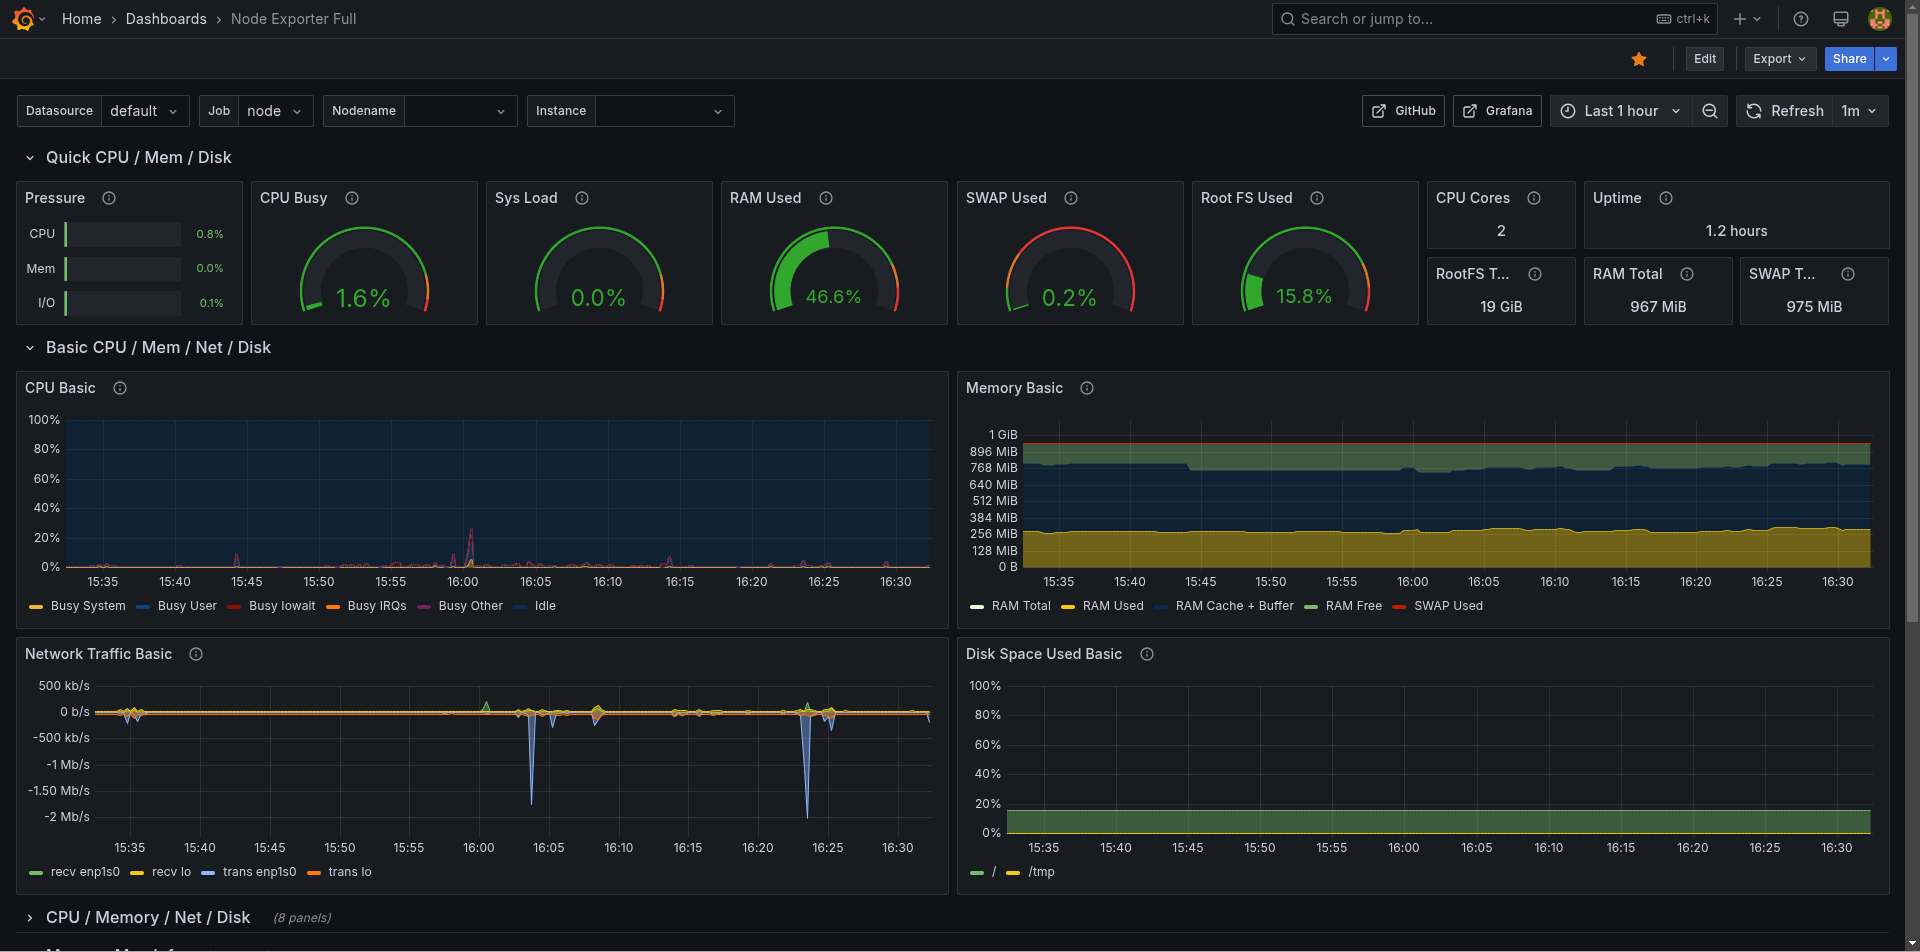
Used Metrics 2020
node_pressure_cpu_waiting_seconds_total
node_pressure_memory_waiting_seconds_total
node_pressure_io_waiting_seconds_total
node_pressure_irq_stalled_seconds_total
-
node_cpu_seconds_total
-
node_load1
-
node_memory_MemAvailable_bytes
-
node_memory_MemTotal_bytes
-
node_memory_SwapTotal_bytes
-
node_memory_SwapFree_bytes
-
node_filesystem_size_bytes
-
node_filesystem_avail_bytes
-
node_time_seconds
-
node_boot_time_seconds
-
node_memory_MemFree_bytes
-
node_memory_Cached_bytes
-
node_memory_Buffers_bytes
-
node_memory_SReclaimable_bytes
-
node_network_receive_bytes_total
-
node_network_transmit_bytes_total