Full Server Status 1,5581,558
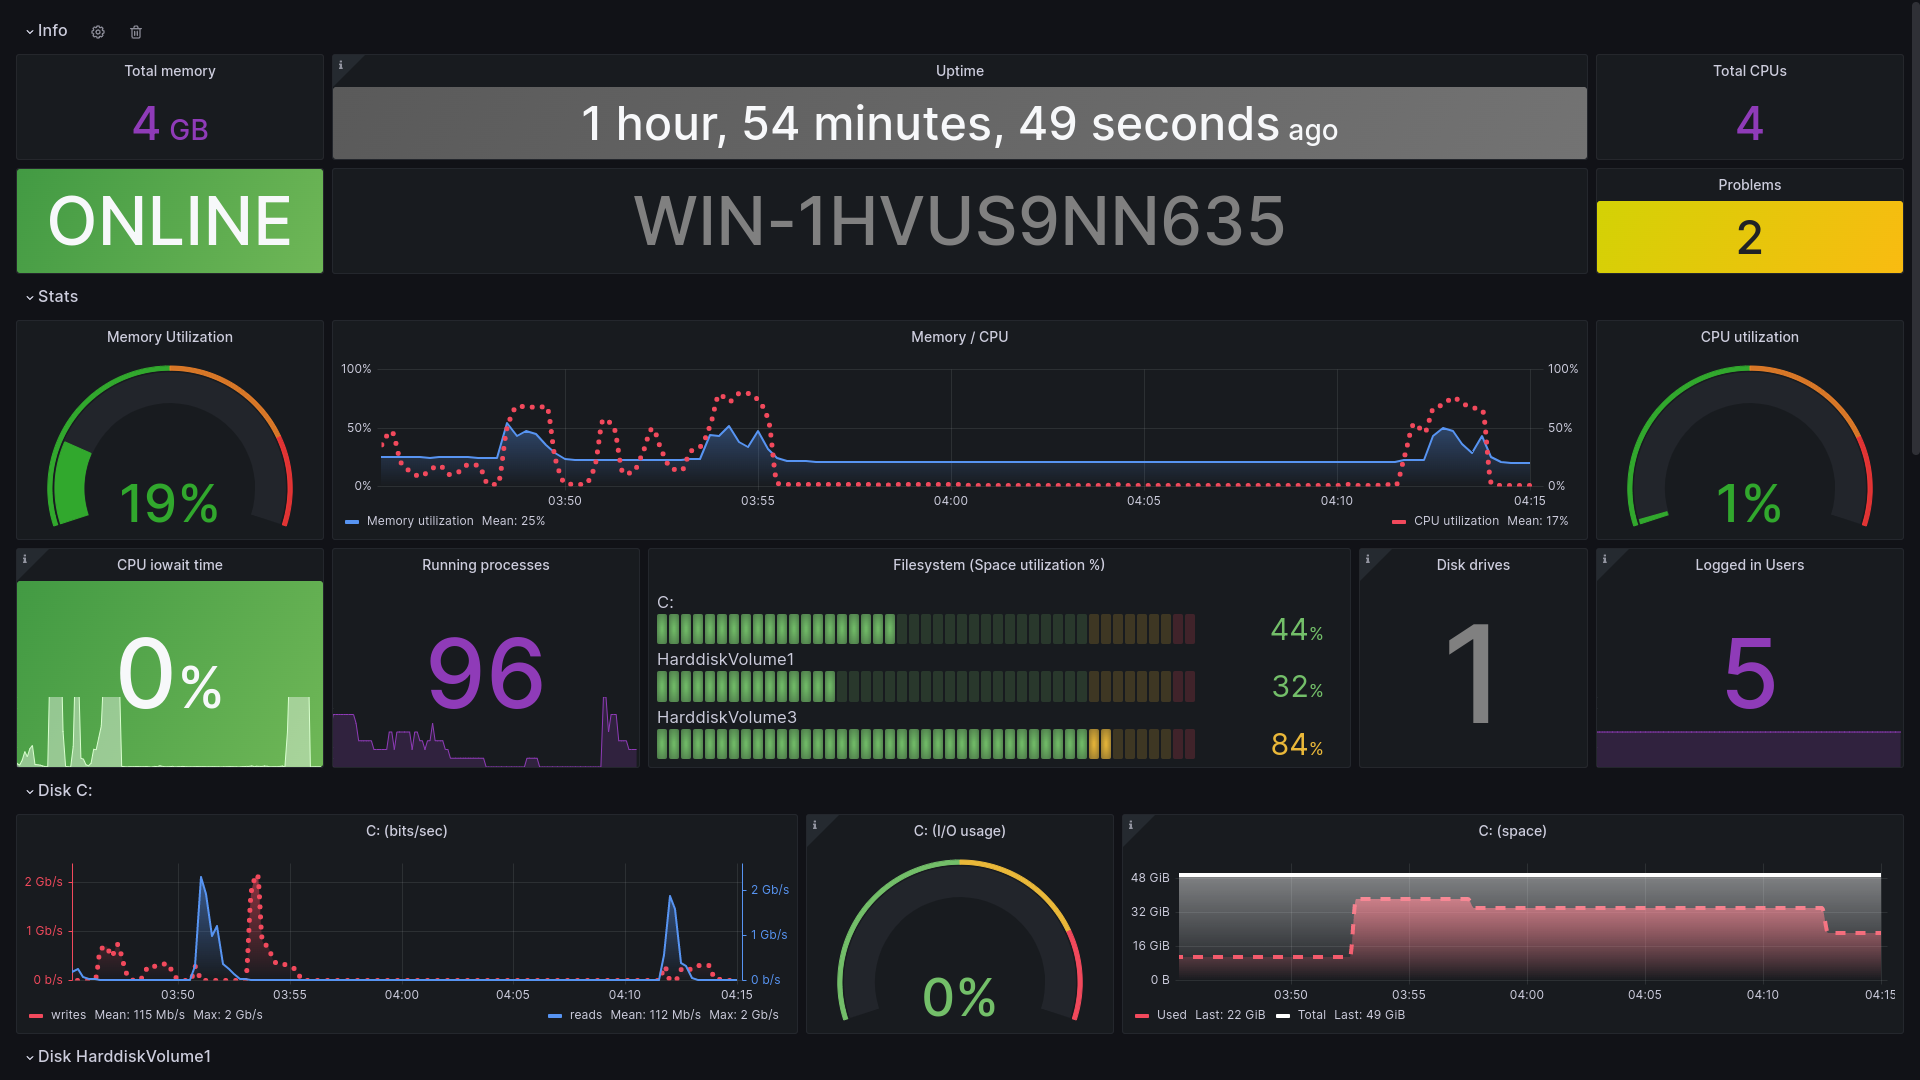
This dashboard provides a comprehensive overview of your server's health, including critical metrics such as uptime, hostname, CPU and memory utilization, running processes, disk usage, network traffic, and alerts from Prometheus rules. Utilizing the node_exporter and windows_exporter, this dashboard delivers rich, real-time insights into your server's performance, allowing you to easily identify bottlenecks, troubleshoot issues, and optimize resource allocation.
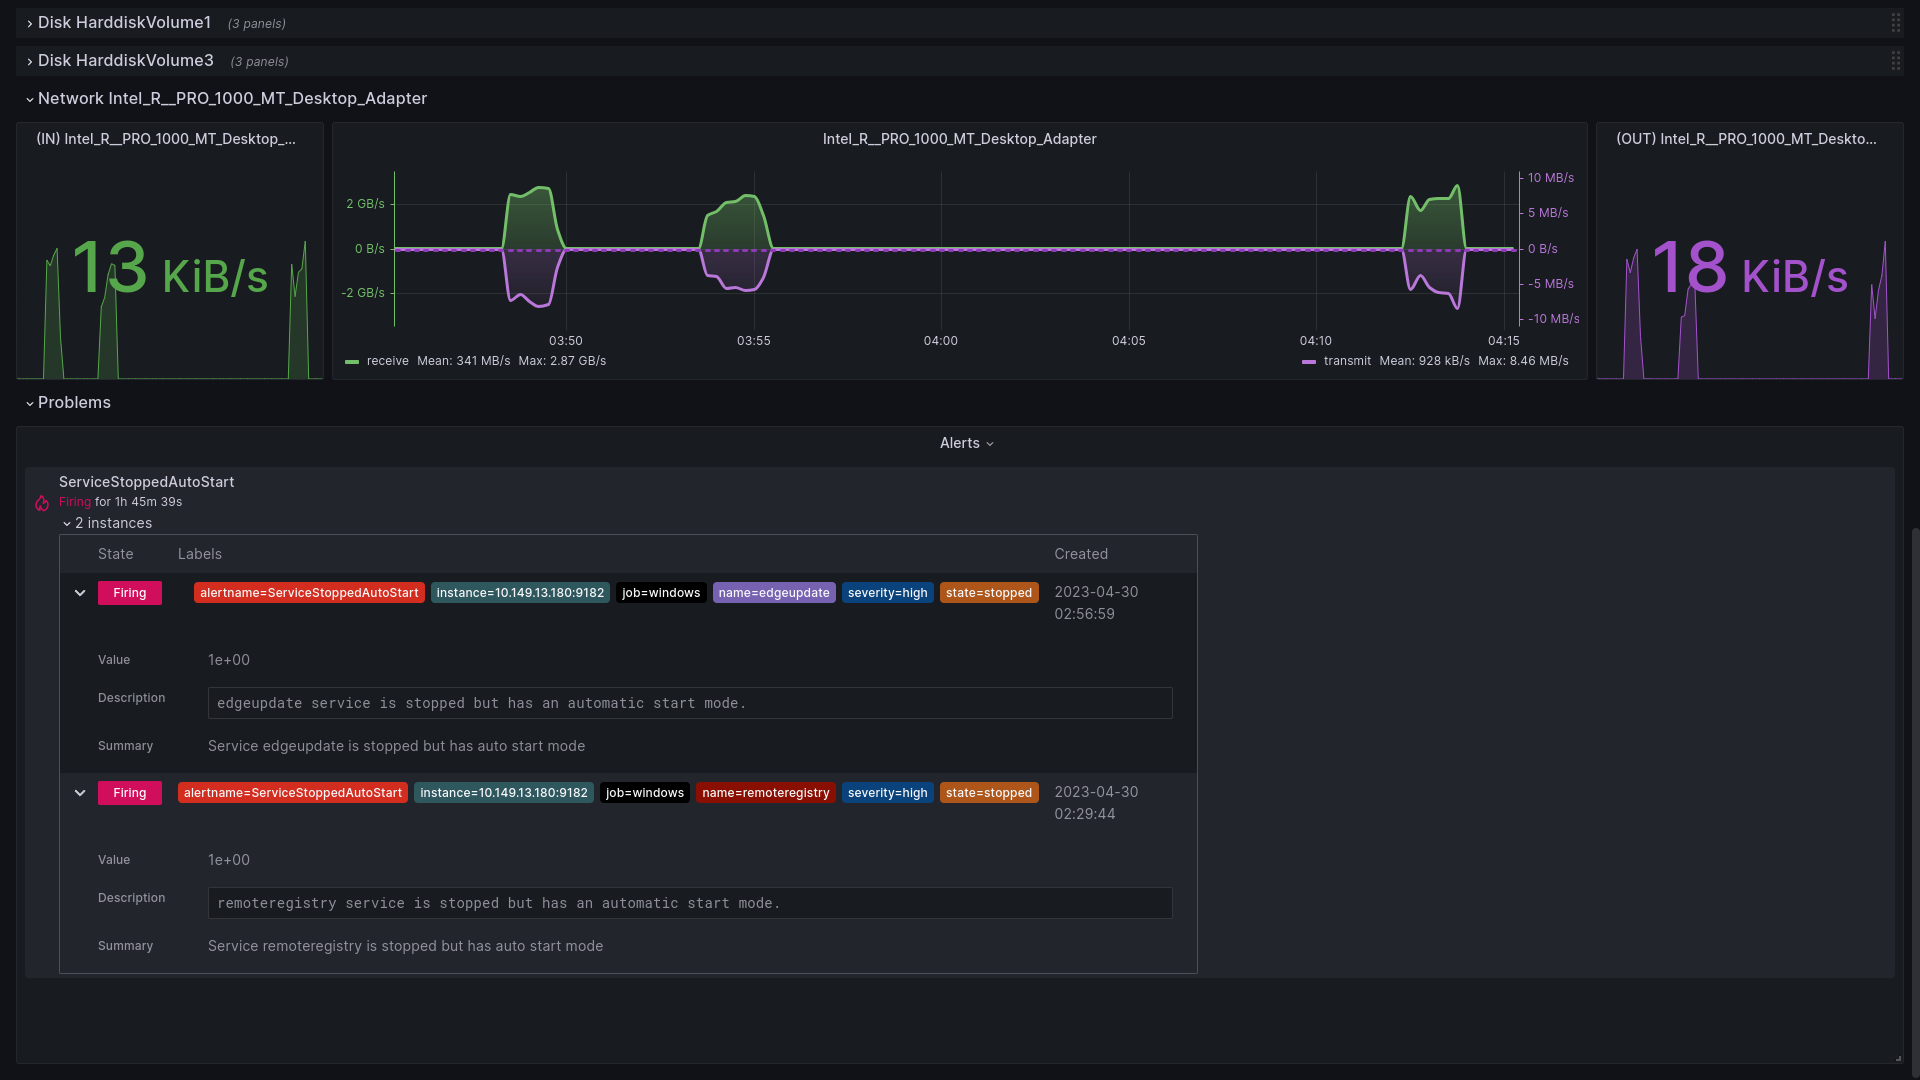
Please note that space utilization per disk (on Disk row) is currently only available on 'windows_exporter', and there is an open GitHub issue related to this. https://github.com/prometheus/node_exporter/issues/885
To get the number of logged users, you need to enable the following collector on node_exporter: --collector.logind. For windows_exporter, you need to enable the following collectors for disk and logged users: --collectors.enabled "[defaults],disk_drive,logon".
This dashboard is based on the original dashboard for Zabbix by Paulo Paim (me) (https://grafana.com/grafana/dashboards/5363-zabbix-full-server-status/). If you have any suggestions, comments, or feedback, please feel free to contact Paulo Paim at paulopaim@outlook.com.
Used Metrics 3535
-
node_memory_MemTotal_bytes
windows_cs_physical_memory_bytes
-
node_time_seconds
-
node_boot_time_seconds
windows_system_system_up_time
-
node_cpu_seconds_total
windows_cs_logical_processors
-
up
-
node_uname_info
windows_cs_hostname
ALERTS
-
node_memory_MemAvailable_bytes
windows_os_physical_memory_free_bytes
windows_cpu_time_total
-
node_procs_running
windows_os_processes
-
node_filesystem_avail_bytes
-
node_filesystem_size_bytes
windows_logical_disk_free_bytes
windows_logical_disk_size_bytes
node_disk_info
windows_disk_drive_info
node_logind_sessions
windows_logon_logon_type
-
node_disk_written_bytes_total
windows_logical_disk_write_bytes_total
-
node_disk_read_bytes_total
windows_logical_disk_read_bytes_total
-
node_disk_io_time_seconds_total
windows_logical_disk_idle_seconds_total
-
node_filesystem_free_bytes
-
node_network_receive_bytes_total
windows_net_bytes_received_total
-
node_network_transmit_bytes_total
windows_net_bytes_sent_total