NodeJS Applications Dashboard 2,1442,144
6/27/2023
7/20/2025
7
DockerWeb Servers
>=12.0.1
Prometheus
Grafana Dashboards
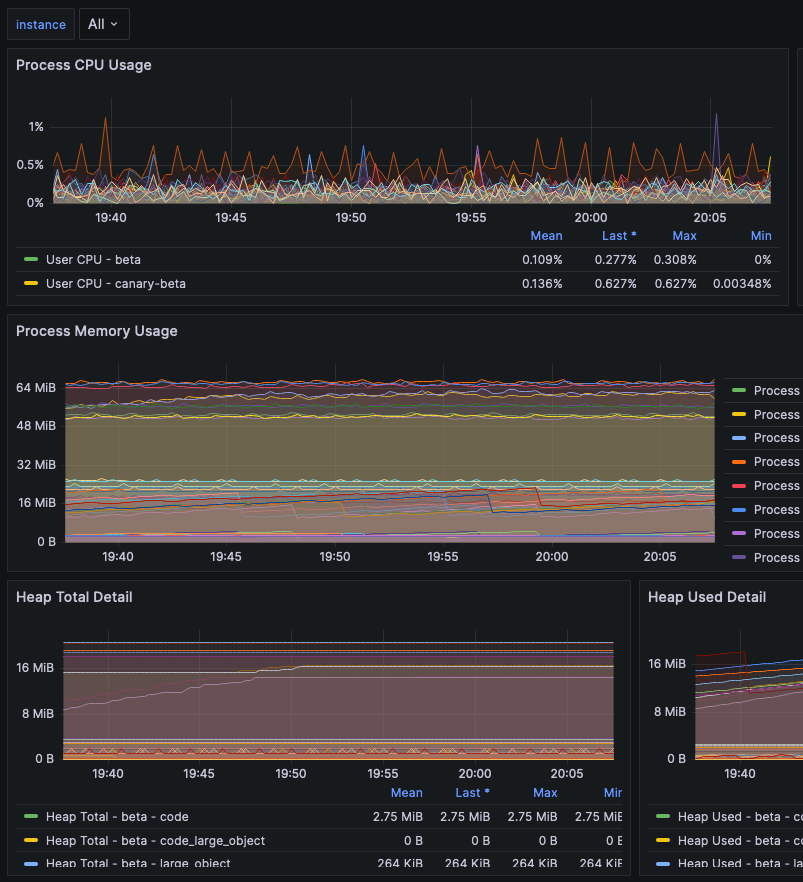
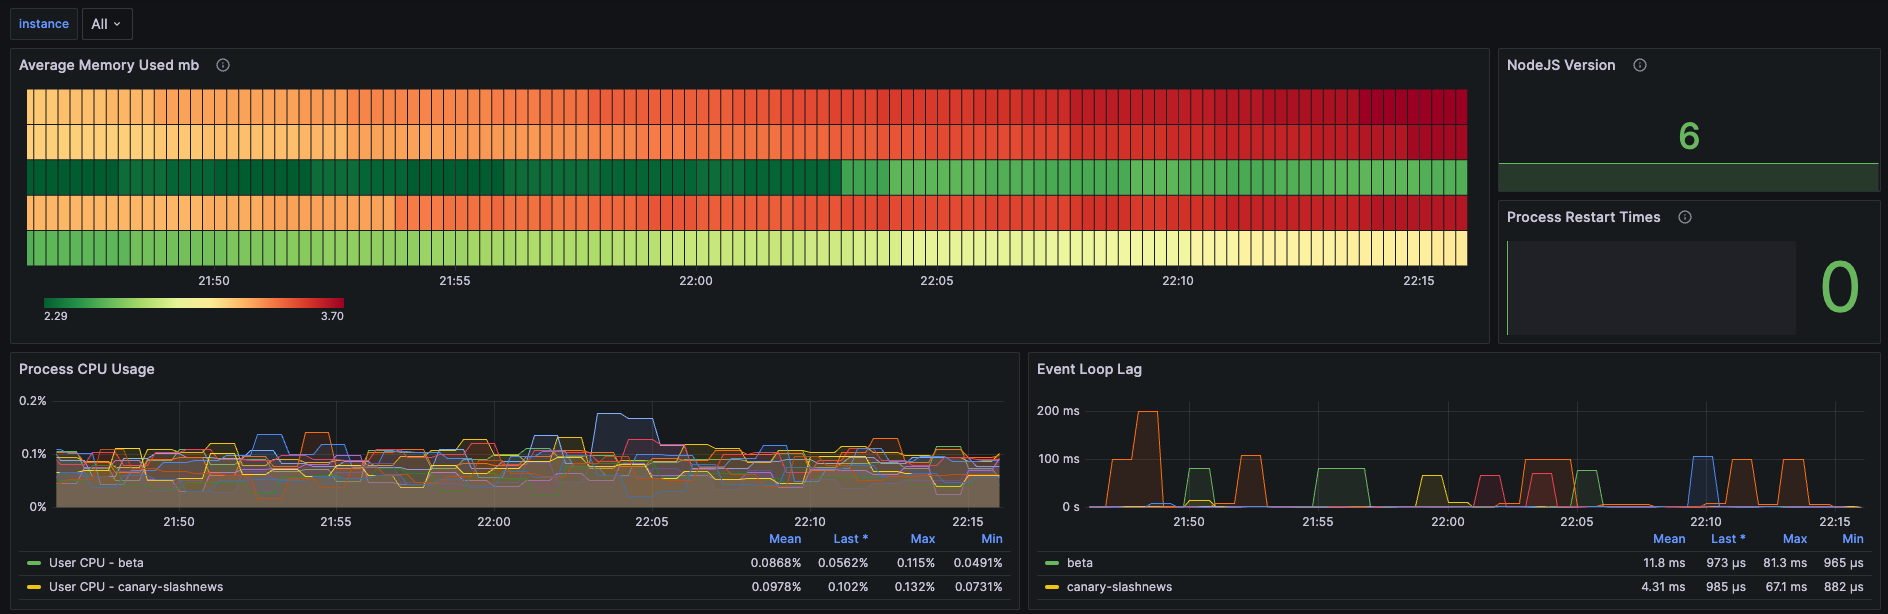
NodeJS prom-client supports a rich collection of prometheus metrics. If you have prometheus and grafana installed on your cluster then prometheus will already be scraping this data due to the scrape annotation on the deployment.
Note
This assumes that you have used Recommended Labels. Make sure you have app.kubernetes.io/name label.
Requirements
- Grafana >= 10.0
Export Dashboard✕
Download
Copy to Clipboard
Used Metrics 1515
-
nodejs_external_memory_bytes
topk
-
nodejs_version_info
-
process_start_time_seconds
-
process_cpu_user_seconds_total
-
process_cpu_system_seconds_total
-
nodejs_eventloop_lag_seconds
-
process_resident_memory_bytes
-
nodejs_heap_size_total_bytes
-
nodejs_heap_size_used_bytes
-
nodejs_active_handles_total
-
nodejs_active_requests_total
-
nodejs_heap_space_size_total_bytes
-
nodejs_heap_space_size_used_bytes
-
nodejs_heap_space_size_available_bytes