Dashboard Monitoring All Server Overview 3,6523,652
8/21/2023
8/21/2023
1
Host MetricsWeb Servers
>=8.5.2
PrometheusPostgreSQLPostgreSQLPostgreSQLPostgreSQLPostgreSQL
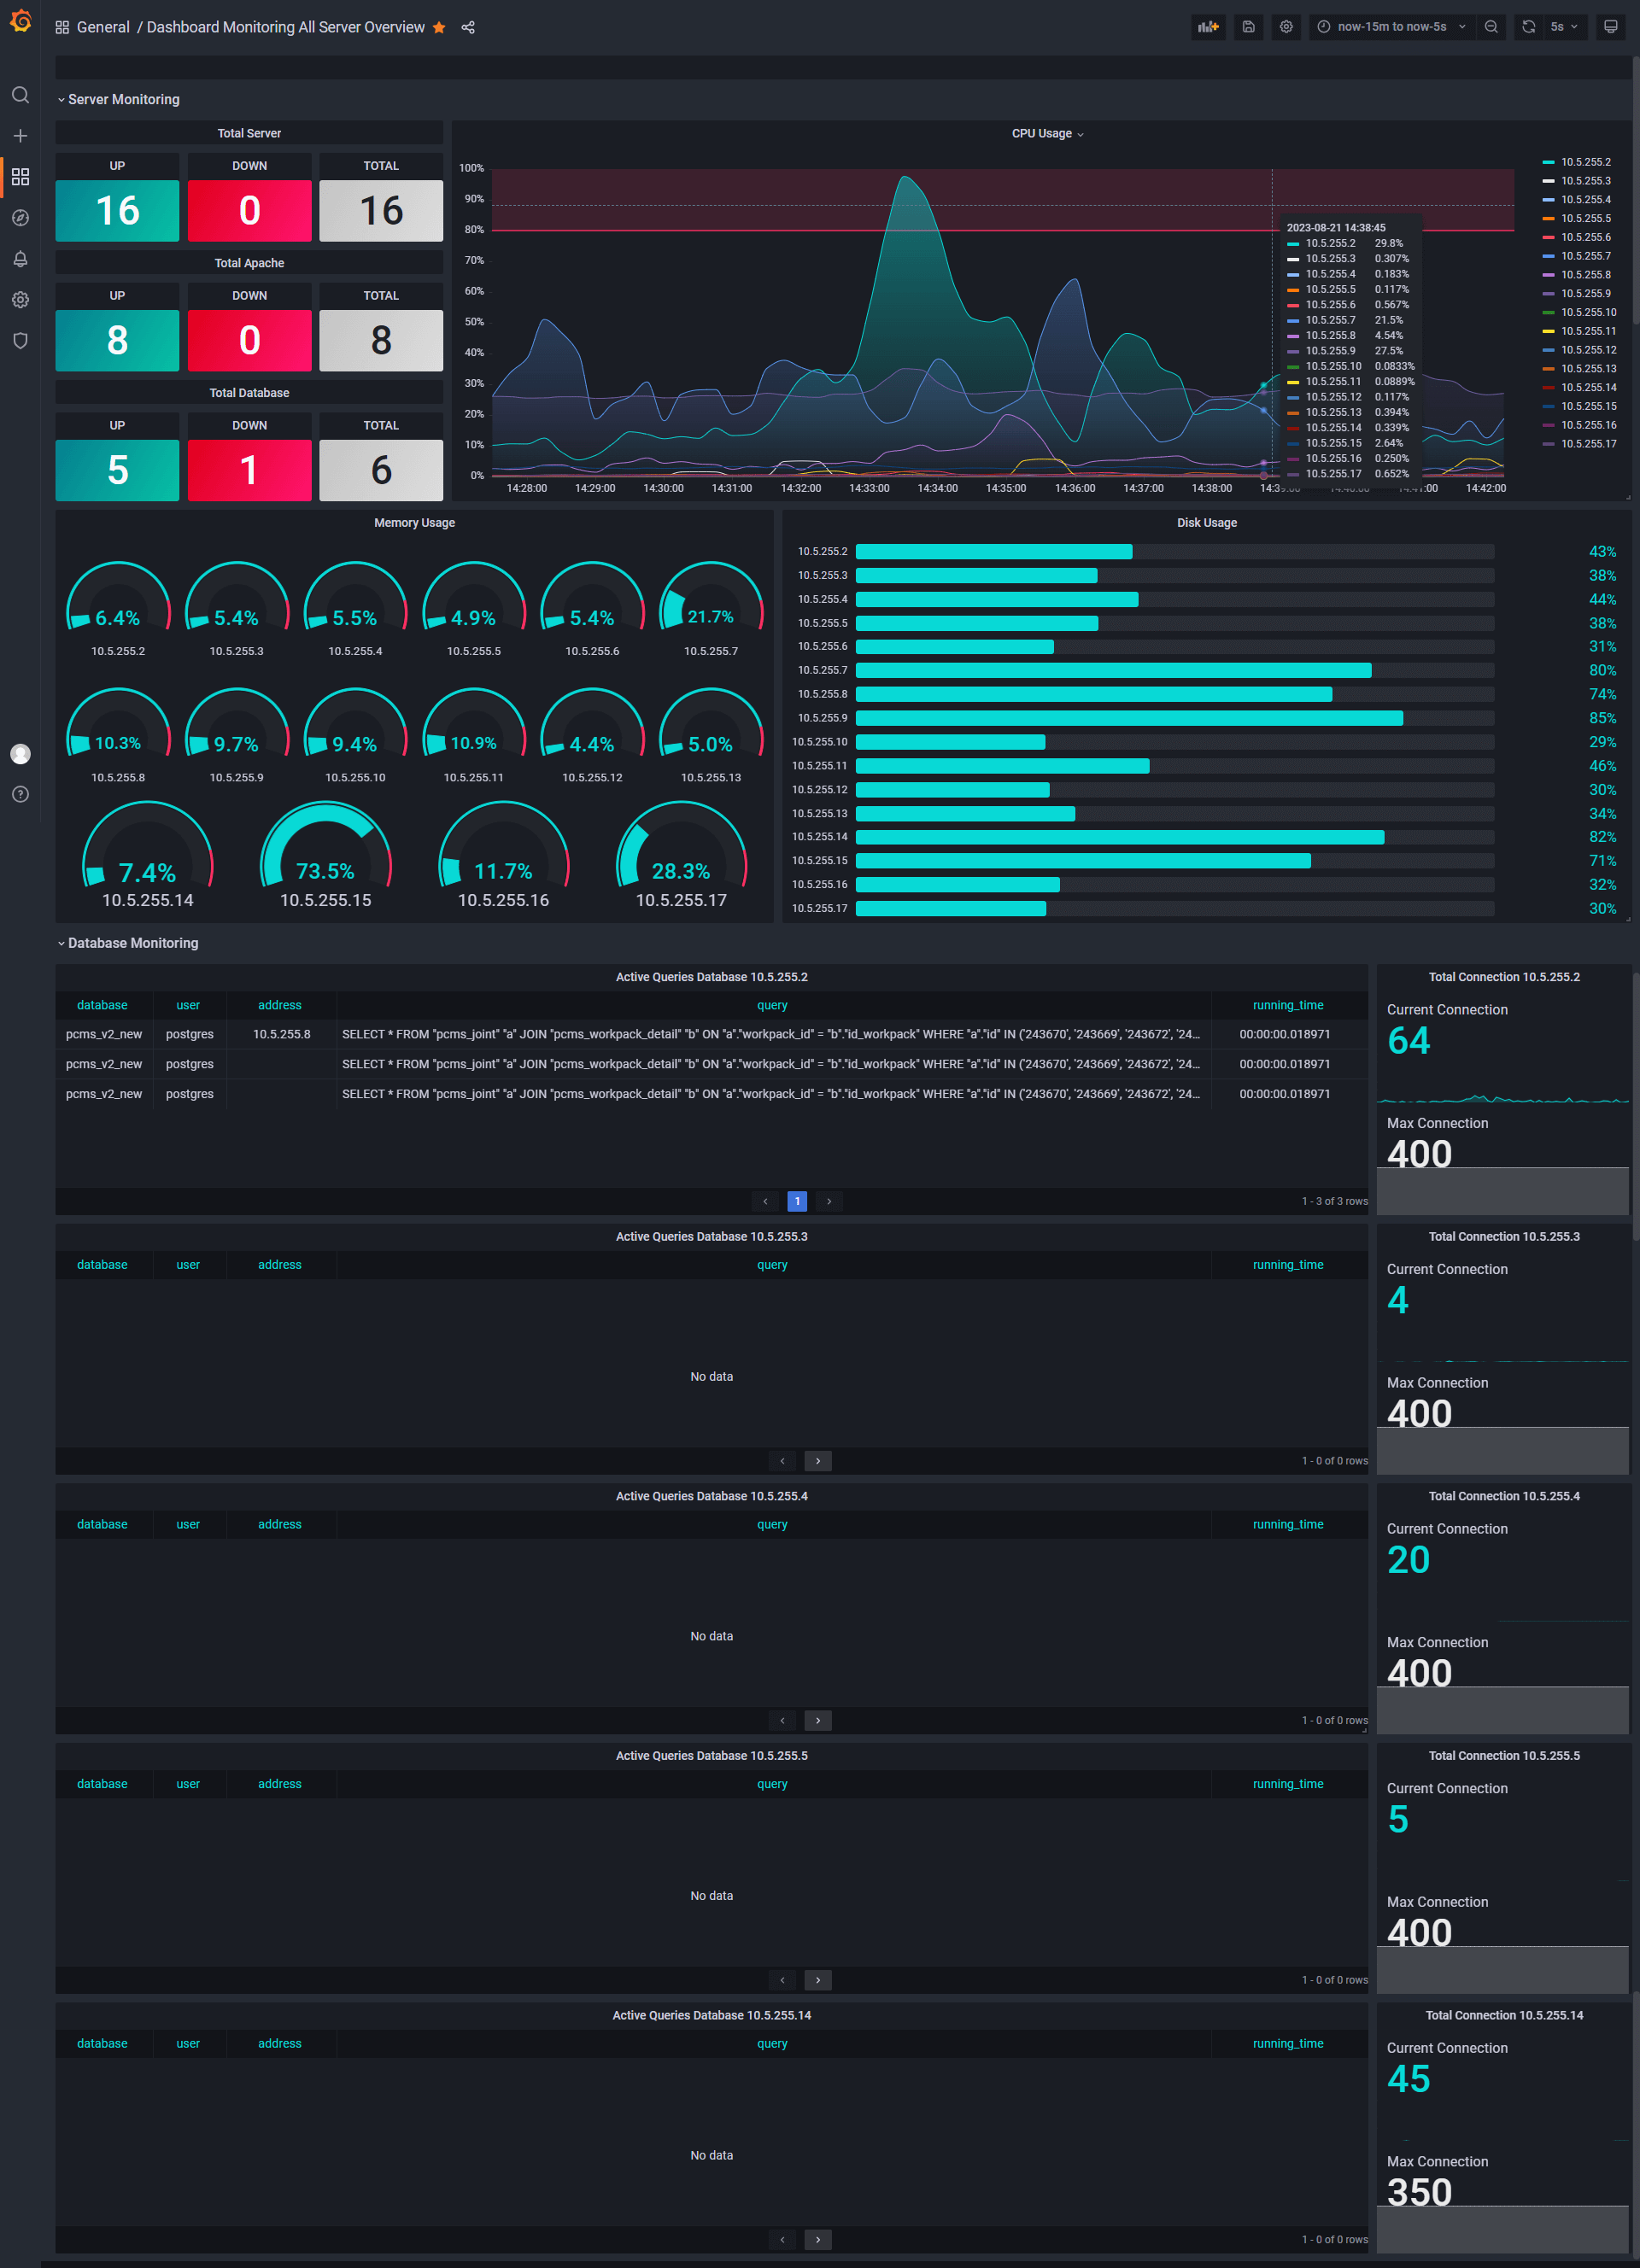
The data from metric which collected by prometheous, and connection to database
Export Dashboard✕
Download
Copy to Clipboard
Used Metrics 1919
node_cpu_seconds_total:9100
node_cpu_seconds_total:9110
-
node_timex_sync_status
total_server
-
apache_up
-
pg_up
node_memory_MemAvailable_bytes:9100
node_memory_MemTotal_bytes:9100
node_memory_MemAvailable_bytes:9110
node_memory_MemTotal_bytes:9110
node_filesystem_avail_bytes:9100
mountpoint
fstype
rootfs
node_filesystem_size_bytes:9100
node_filesystem_avail_bytes:9110
node_filesystem_size_bytes:9110
pg_stat_activity_count:9101
pg_settings_max_connections:9101