Kubernetes Workloads CPU and Memory Metrics 8,8758,875
1/28/2024
8/31/2024
3
Docker
>=11.1.0
Prometheus
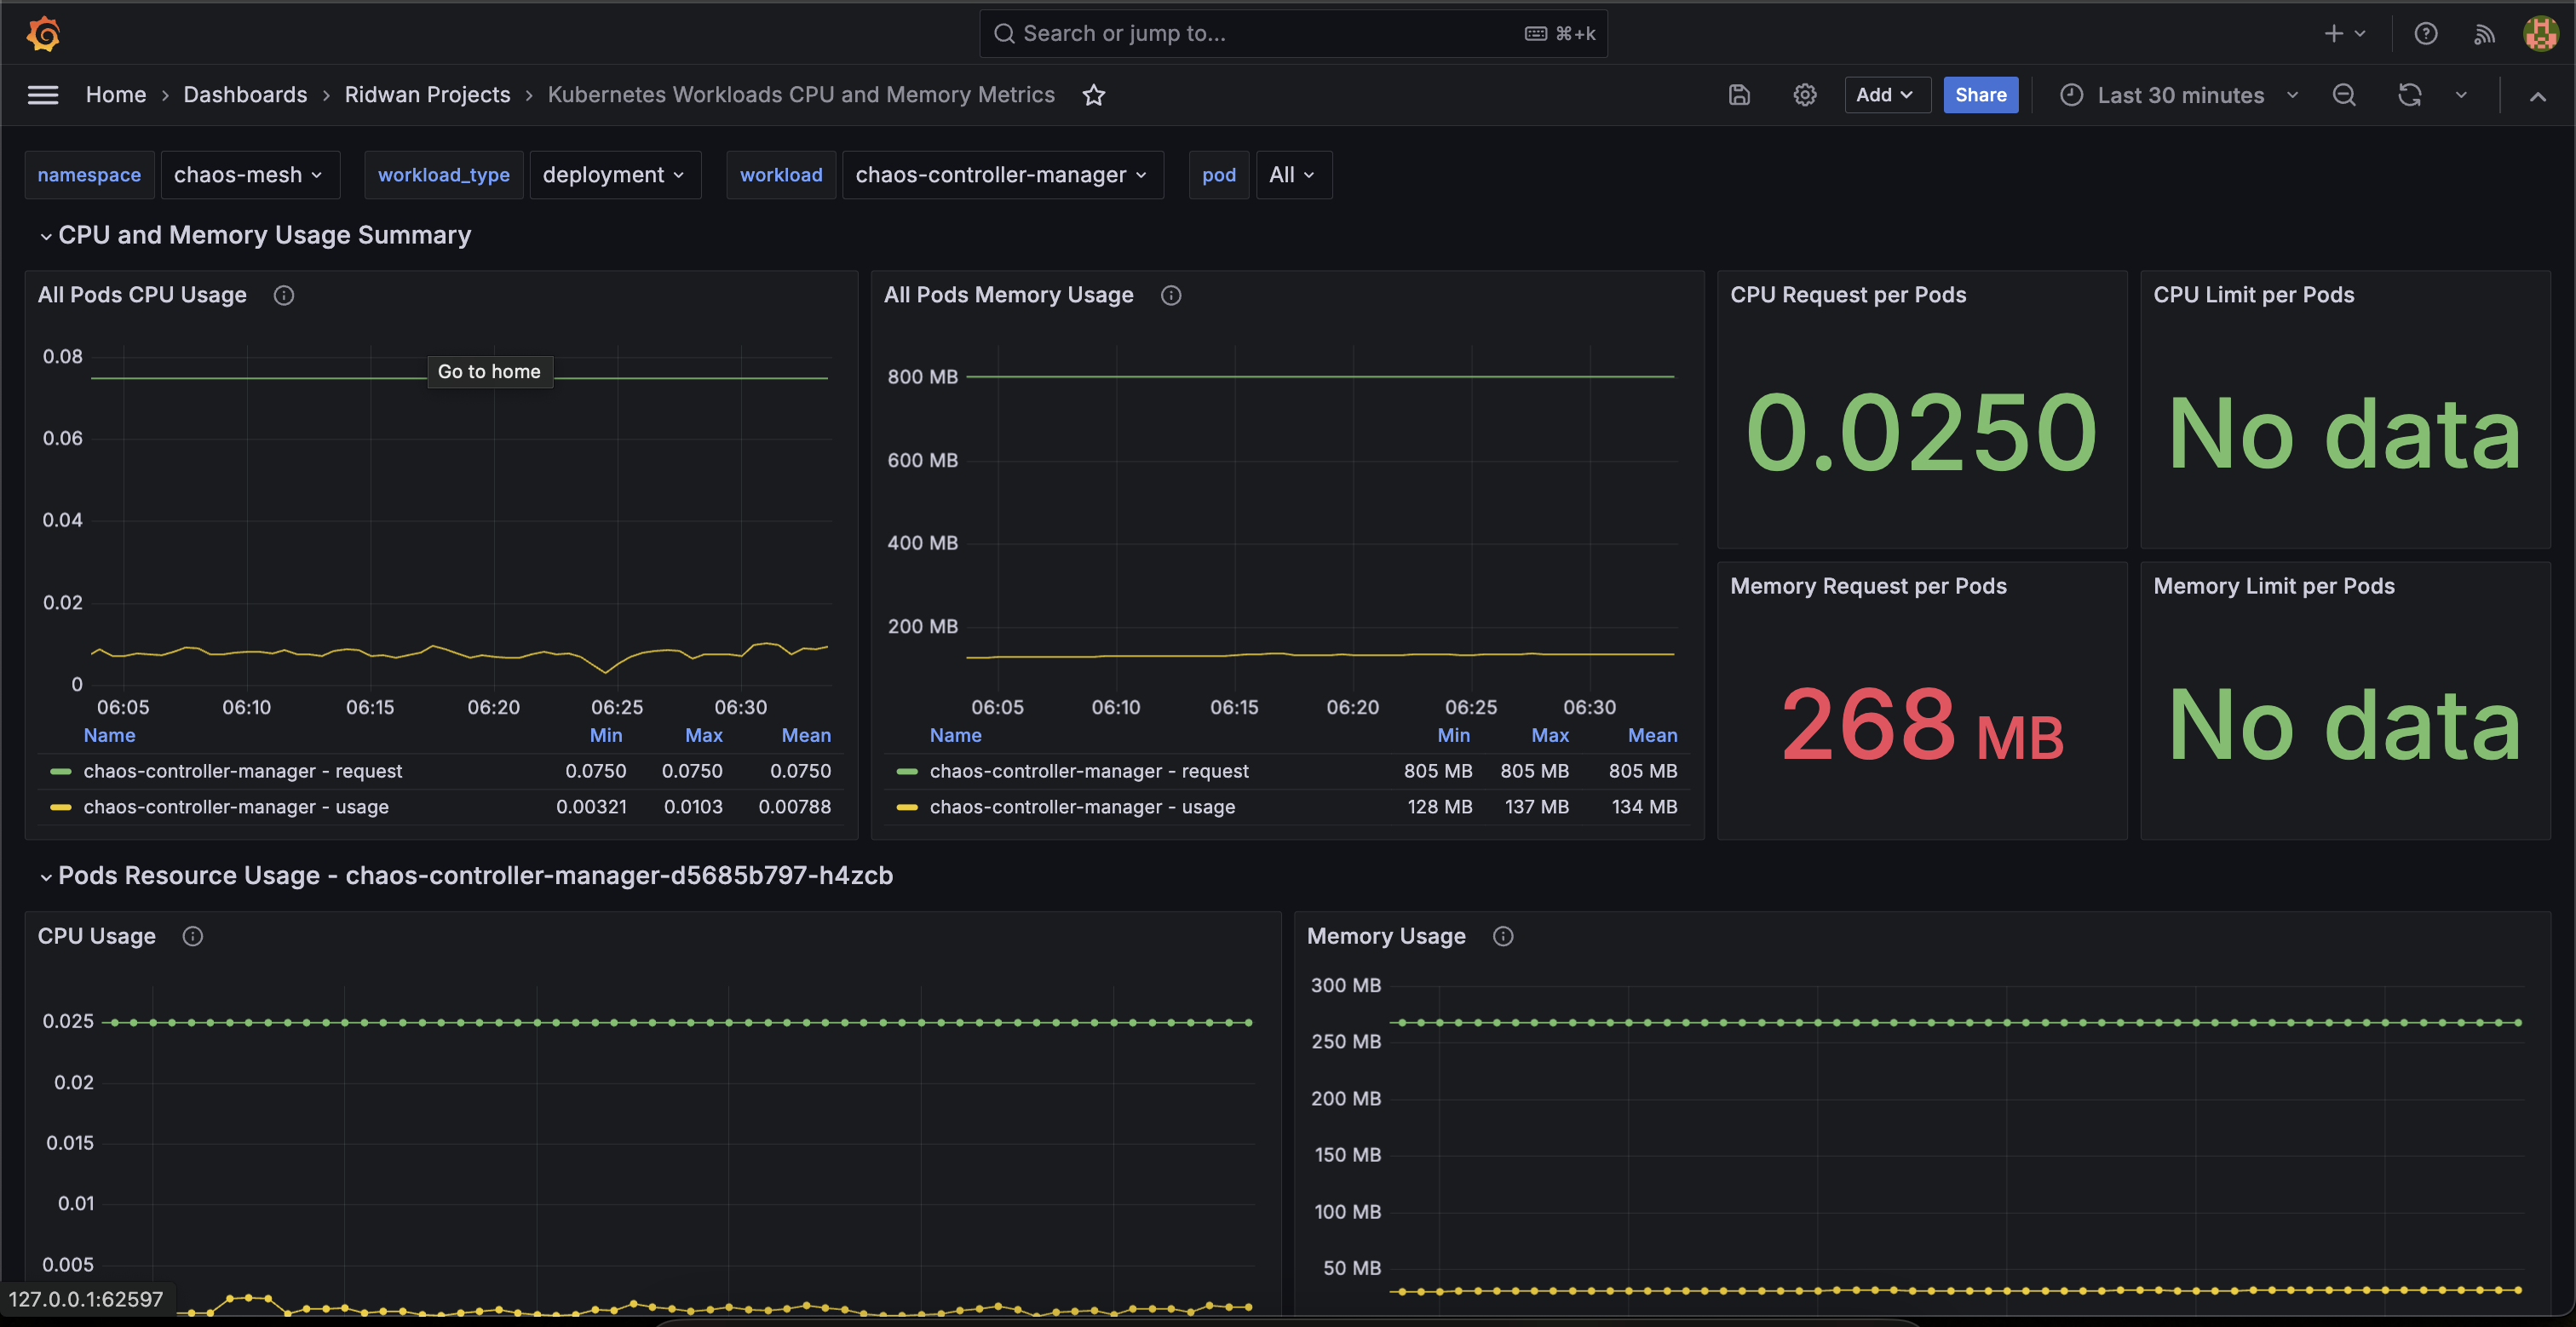
Simple dashboard for observing your Kubernetes Deployment CPU and Memory usage based on Kube State Metrics for Deployment only.
Requirements
- Prometheus
- Kube State Metrics
- Kubernetes cAdvisor
Built-in features
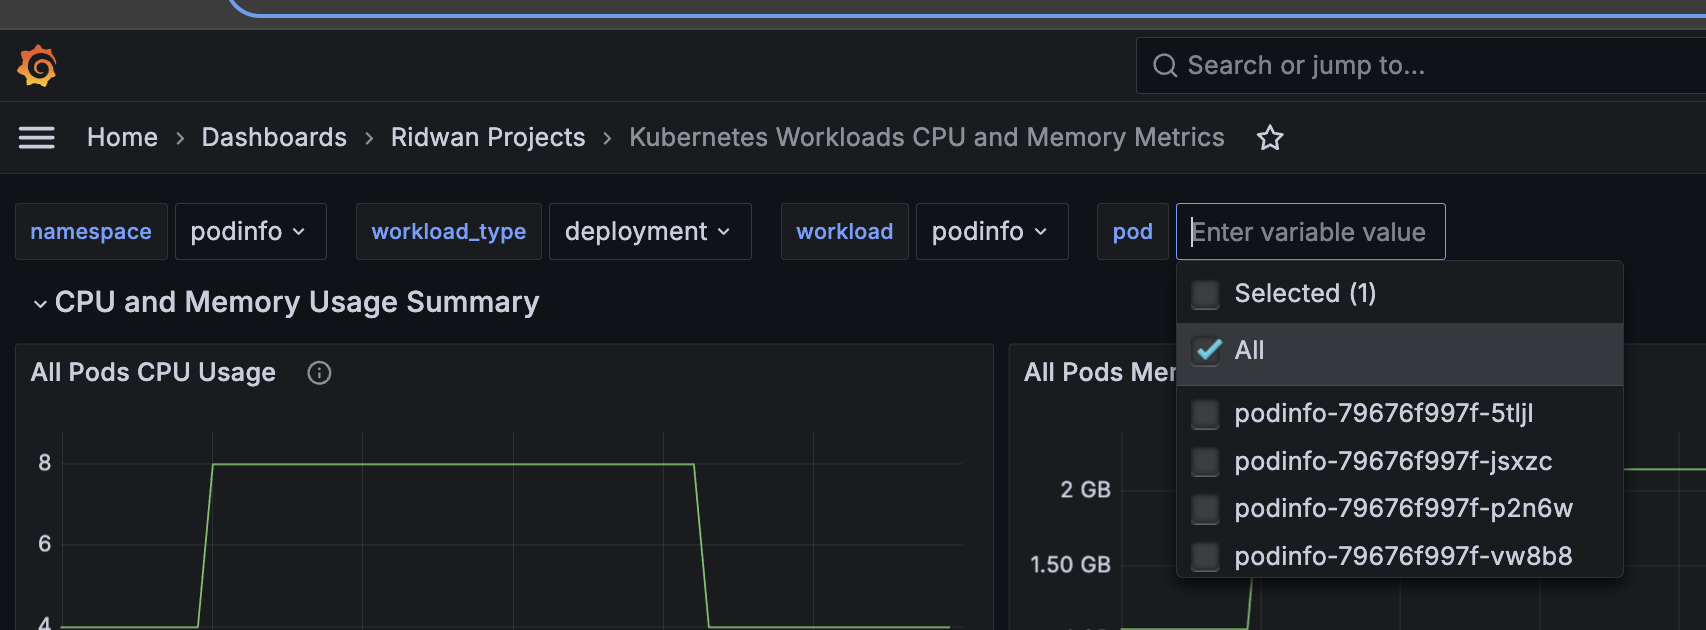
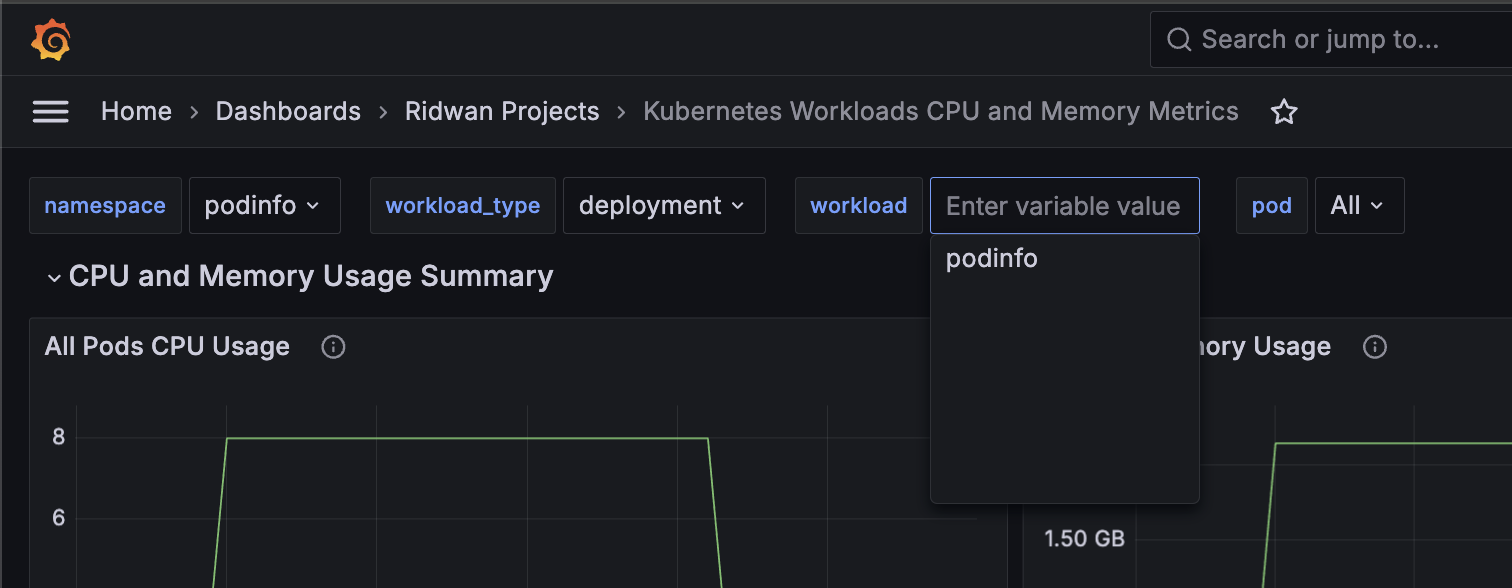
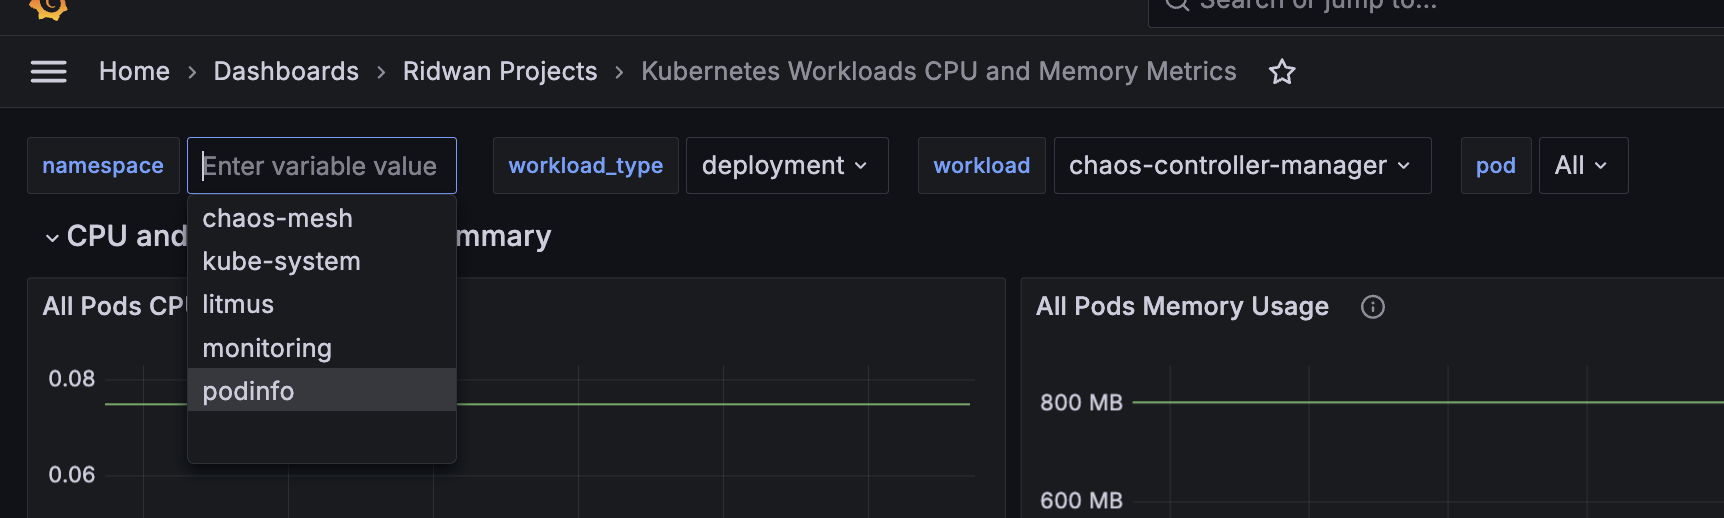
- filters: you could filters your Deployment based on namespace, deployment and pods
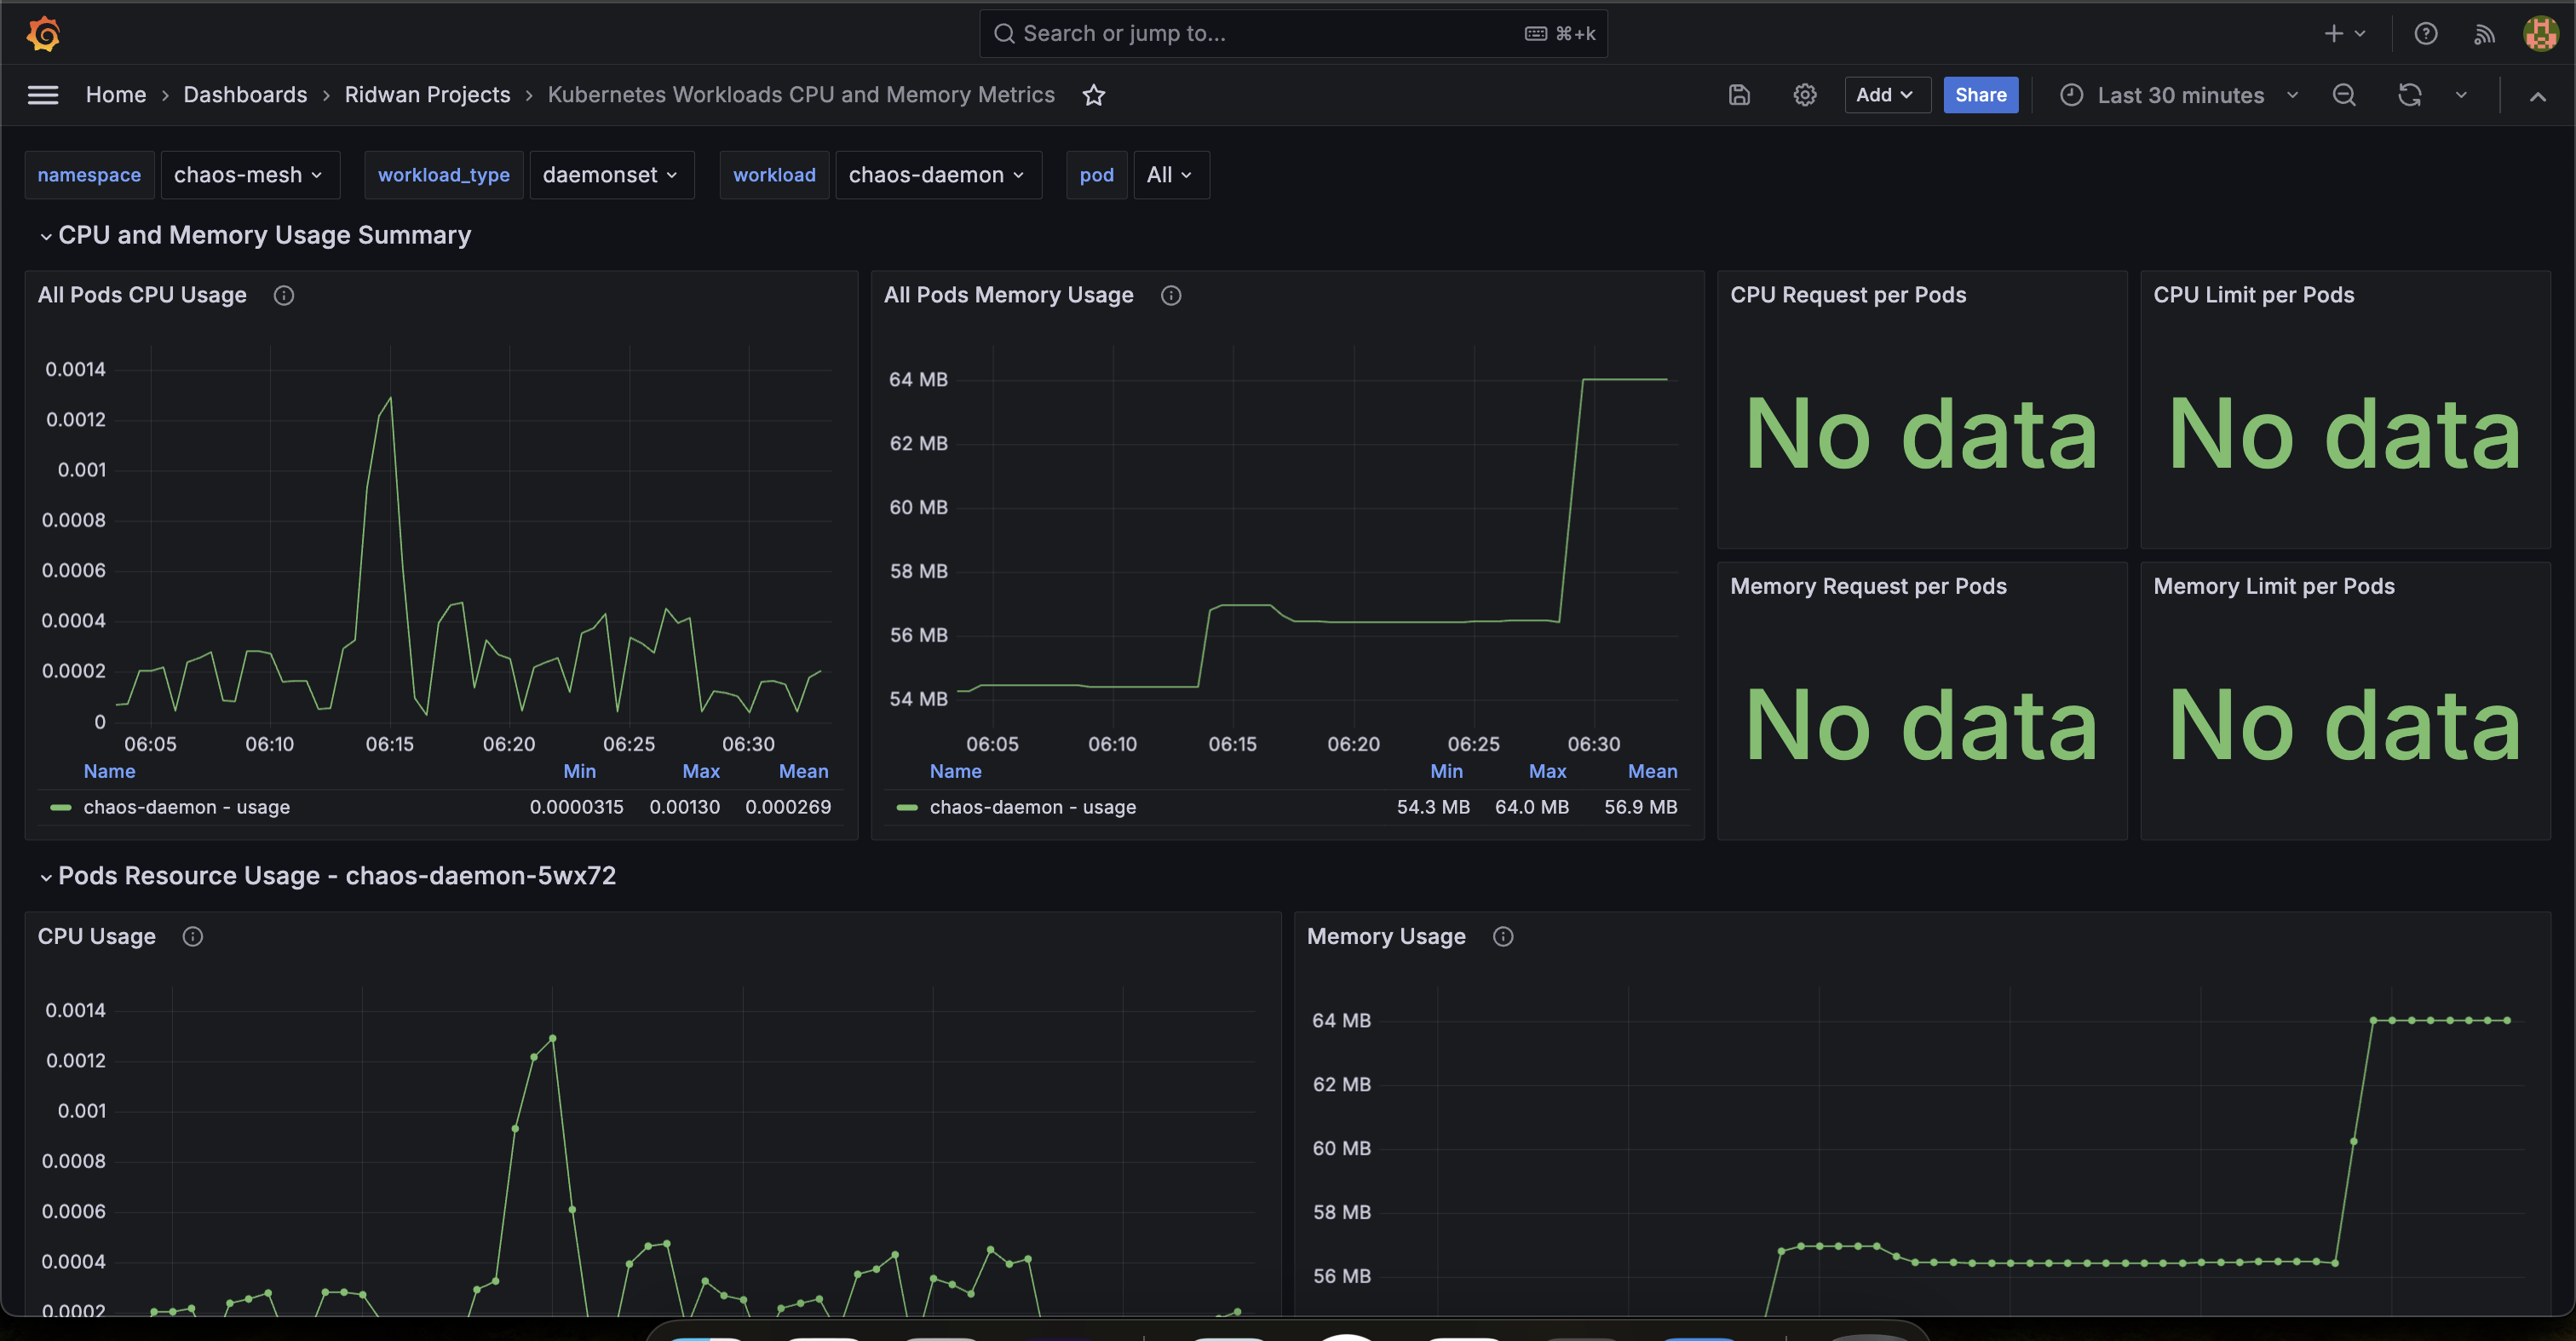
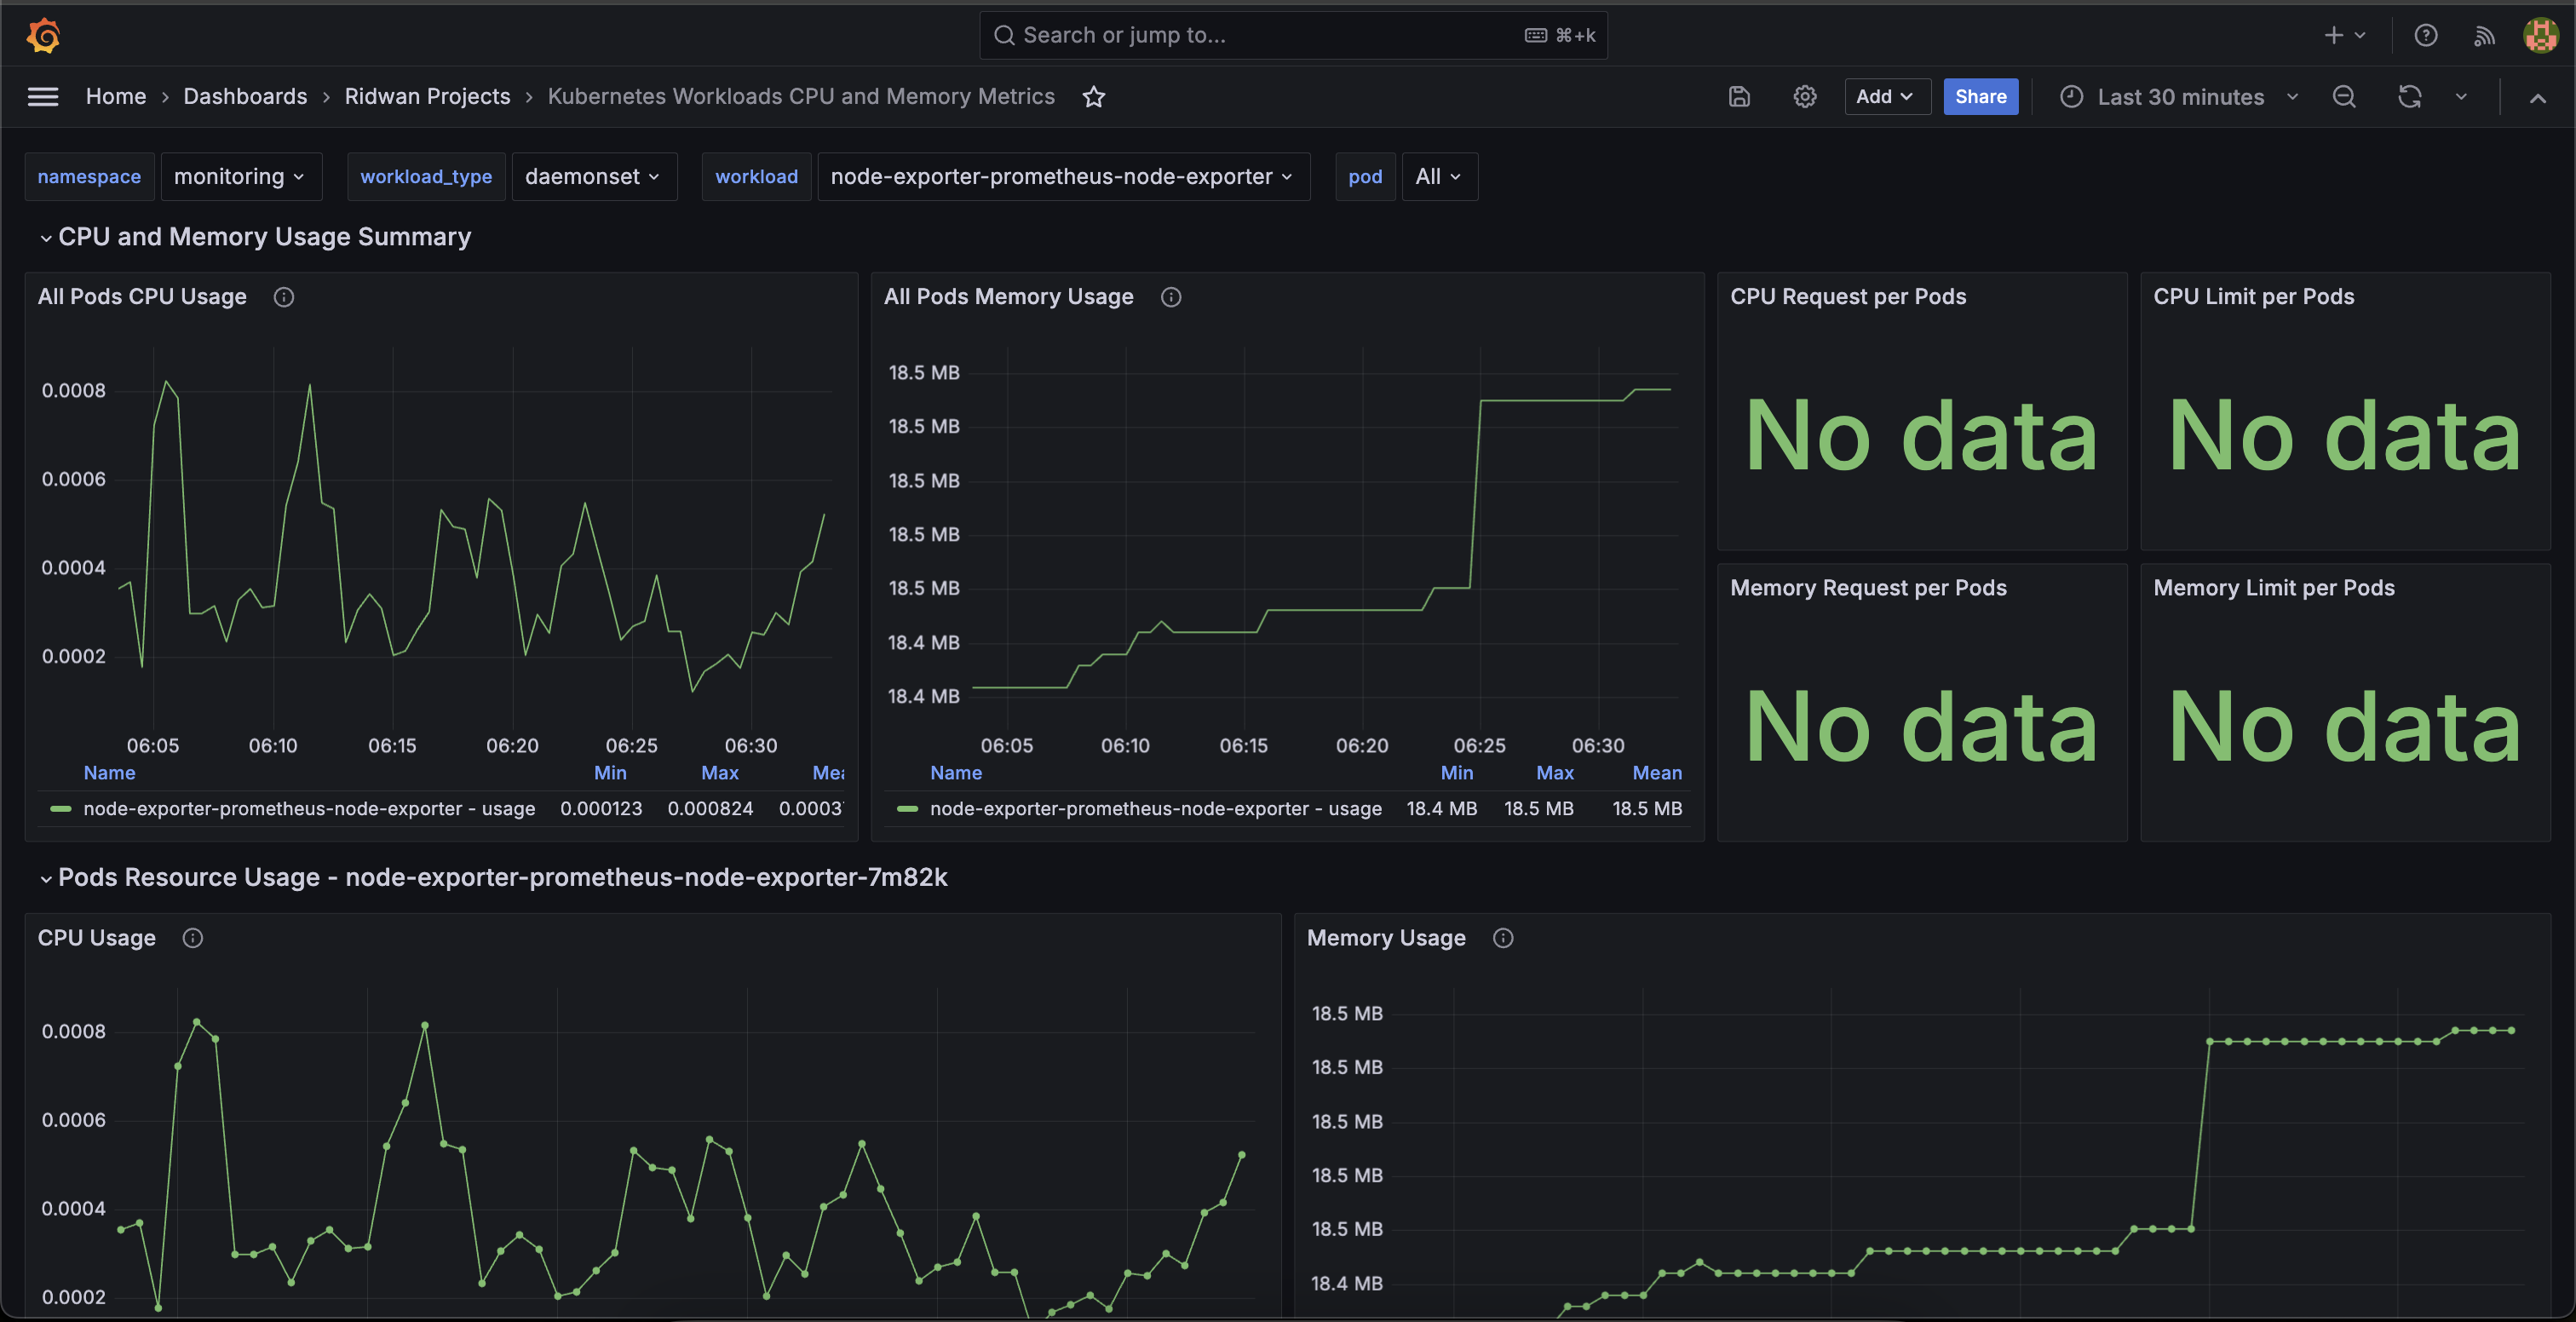
- summary rows: you could see CPU and memory usage per deployment. It's aggregated by sum from all pods CPU and memory usage within the deployment. You can see also the CPU and memory request / limit config on this panel
- pods resource usage rows: you could see repeatable rows based on num of pods which available on the deployment. You can see CPU and Memory usage specifically for selected pods
Testing
- Grafana version: 9.5.3
- K8s distribution: Minikube
- Testing tools: stress-ng
Fixes
2 Aug 2024
- set tooltip mode in all line chart panels to "All"
- fix aggregate on cpu limit query for the deployment
- fix aggregate on memory limit query for the deployment
1 Sep 2024
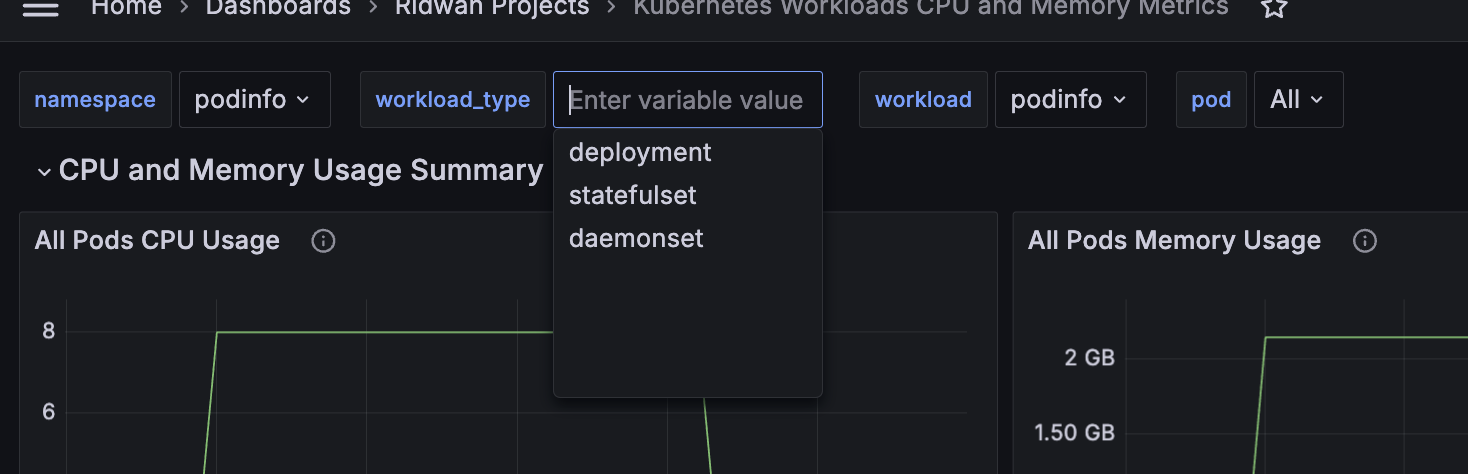
- add filter for statefulset and daemonset
Export Dashboard✕
Download
Copy to Clipboard
Used Metrics 55
kube_pod_container_resource_limits
namespace_workload_pod:kube_pod_owner:relabel
kube_pod_container_resource_requests
-
container_cpu_usage_seconds_total
-
container_memory_usage_bytes