KrakenD - OpenTelemetry + Prometheus 1,5071,507
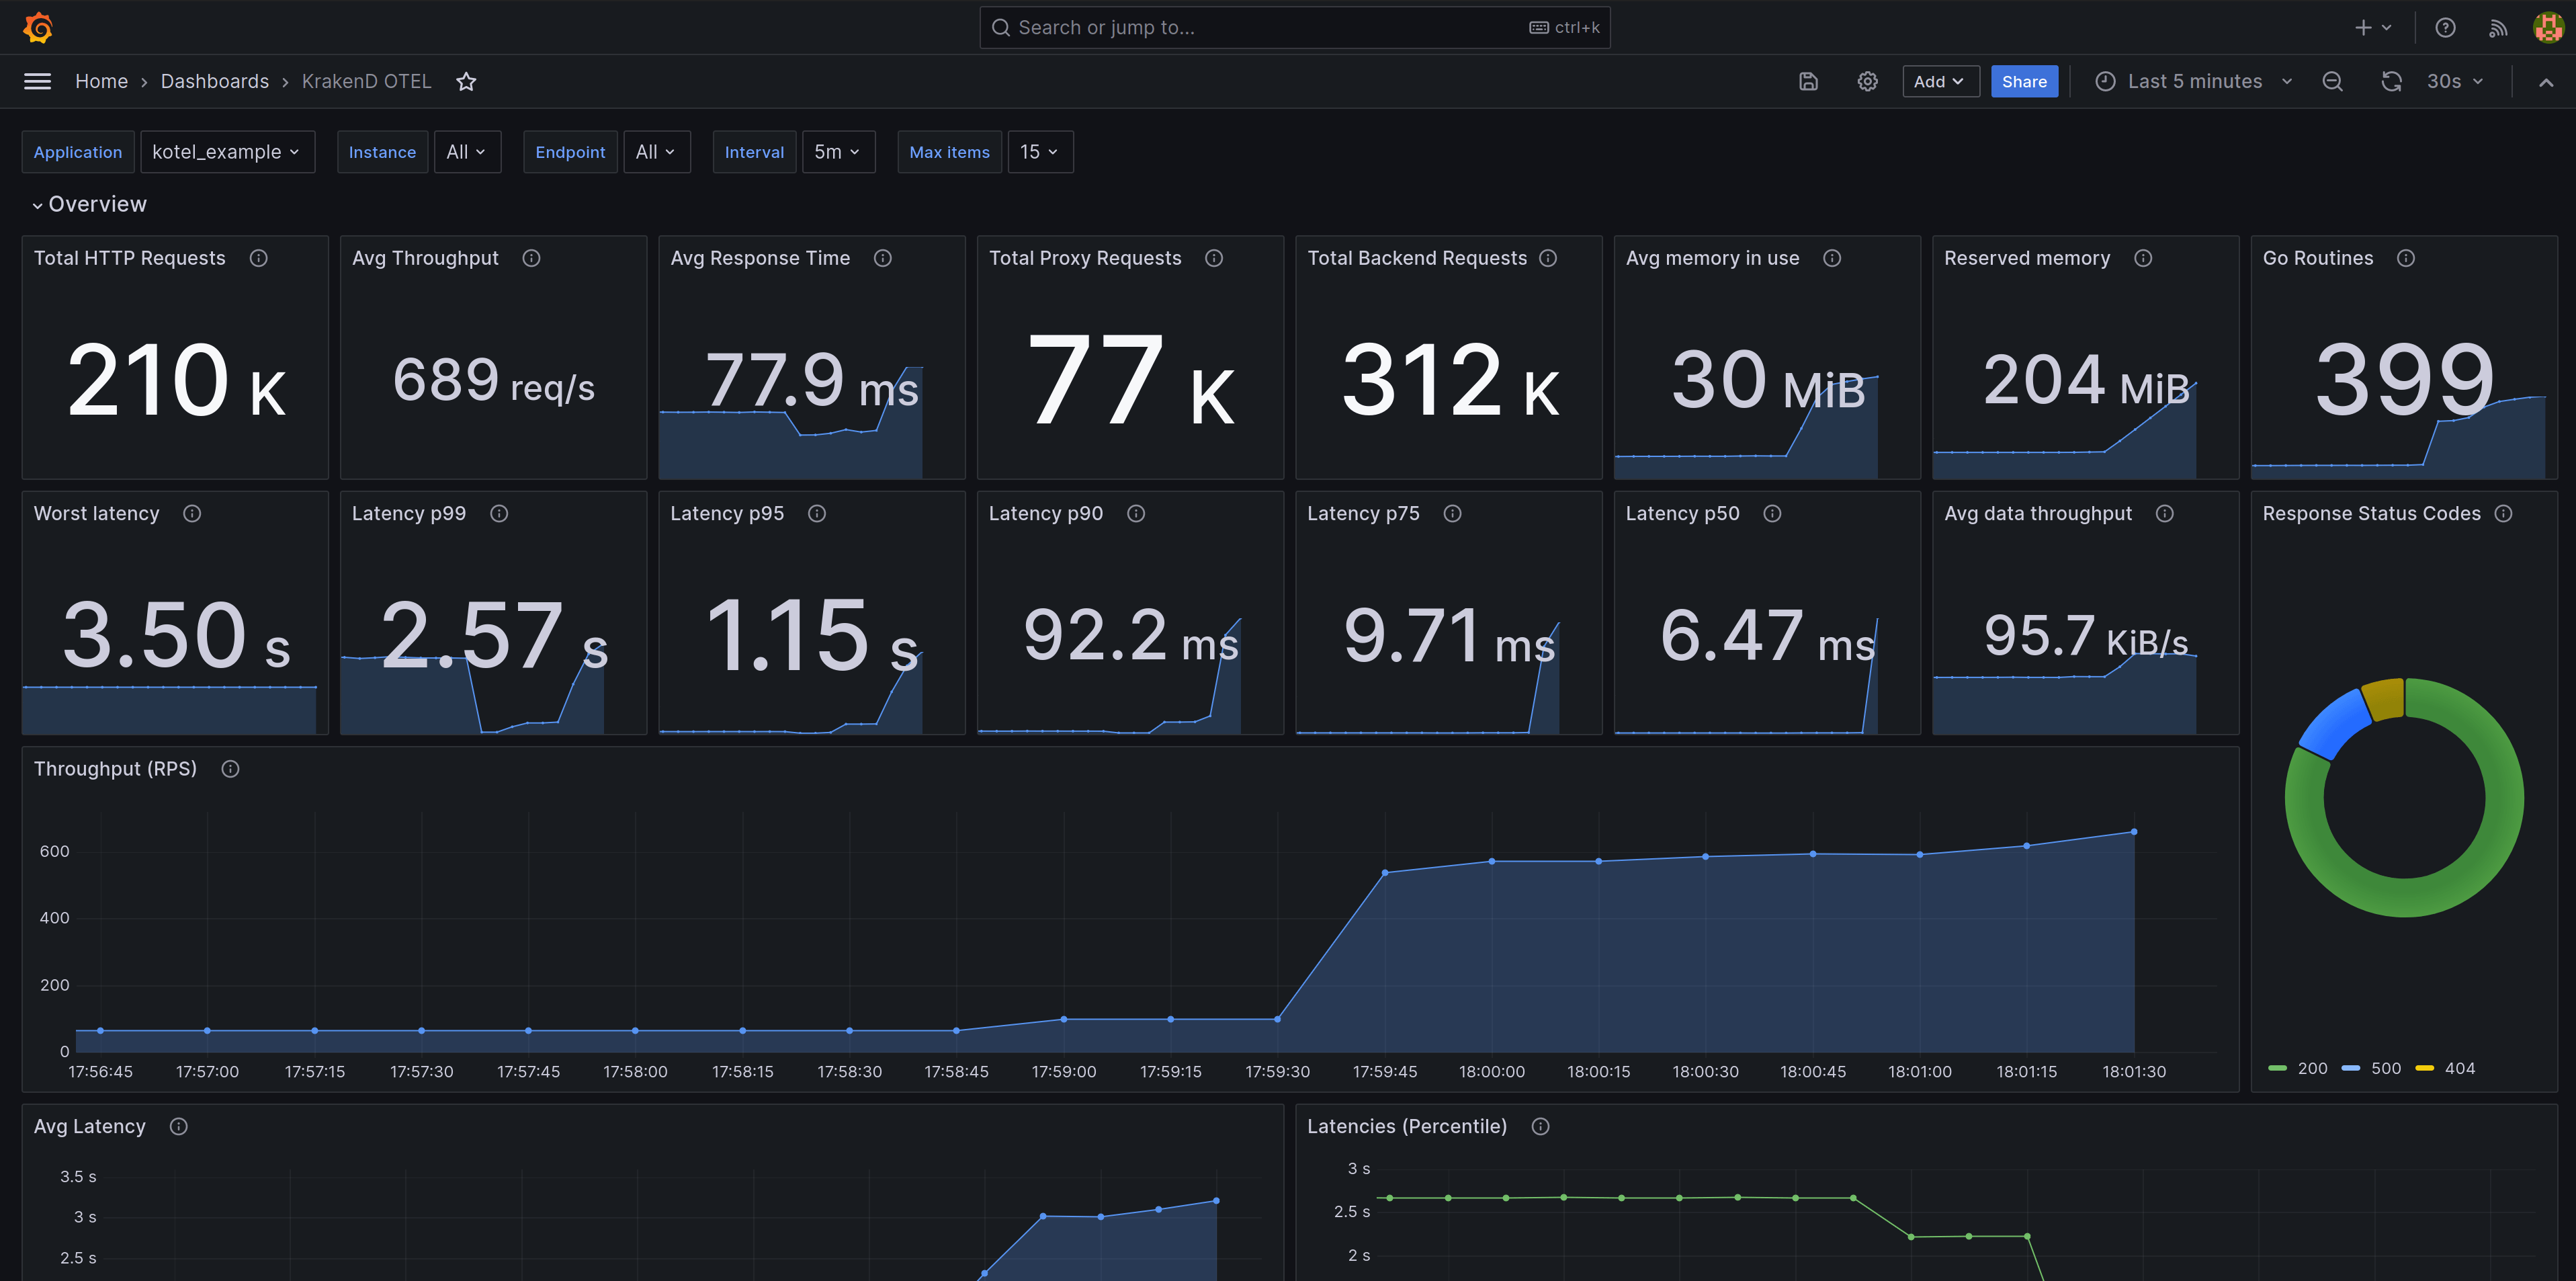
The preconfigured Grafana dashboard for KrakenD offers valuable information to understand the performance of your services and detect anomalies in the service.
The dashboard is extensive and offers you metrics like:
- Requests from users to KrakenD
- Requests from KrakenD to your backends
- Response times
- Memory usage and details
- Endpoints and status codes
- Latencies
- Heatmaps
- Open connections
- Throughput
- Distributions, timers, garbage collection and a long etcetera
Resources:
Used Metrics 5353
http_server_duration_count
__range_s
http_server_duration_sum
krakend_proxy_duration_count
krakend_backend_duration_count
-
go_memstats_alloc_bytes
-
go_memstats_sys_bytes
-
go_goroutines
http_server_duration_bucket
http_server_response_size_sum
interval
http_server_response_size_count
krakend_proxy_duration_bucket
krakend_backend_duration_bucket
http_client_response_size_sum
http_client_response_size_count
topk
max_list
http_server_response_size_bucket
krakend_proxy_duration_sum
http_client_duration_count
http_client_duration_sum
http_client_duration_bucket
http_client_response_no_content_length_total
http_client_request_read_size_hist_sum
http_client_request_read_size_hist_count
http_client_response_size_bucket
http_client_request_failed_count_total
http_client_request_timedout_count_total
http_client_request_started_count_total
http_client_request_canceled_count_total
http_client_request_get_conn_duration_bucket
http_client_request_dns_duration_bucket
http_client_request_tls_duration_bucket
http_client_request_get_conn_duration_sum
http_client_request_get_conn_duration_count
http_client_request_dns_duration_sum
http_client_request_dns_duration_count
http_client_request_tls_duration_sum
http_client_request_tls_duration_count
krakend_backend_duration_sum
go_gc_duration_seconds_sum
go_gc_duration_seconds_count
-
go_gc_duration_seconds
-
go_memstats_alloc_bytes_total
-
go_memstats_frees_total
-
go_memstats_heap_objects
-
go_memstats_heap_released_bytes
-
go_memstats_heap_inuse_bytes
-
go_memstats_heap_idle_bytes
-
go_memstats_stack_inuse_bytes
-
go_memstats_stack_sys_bytes
-
go_threads