Windows fleet overview 879879
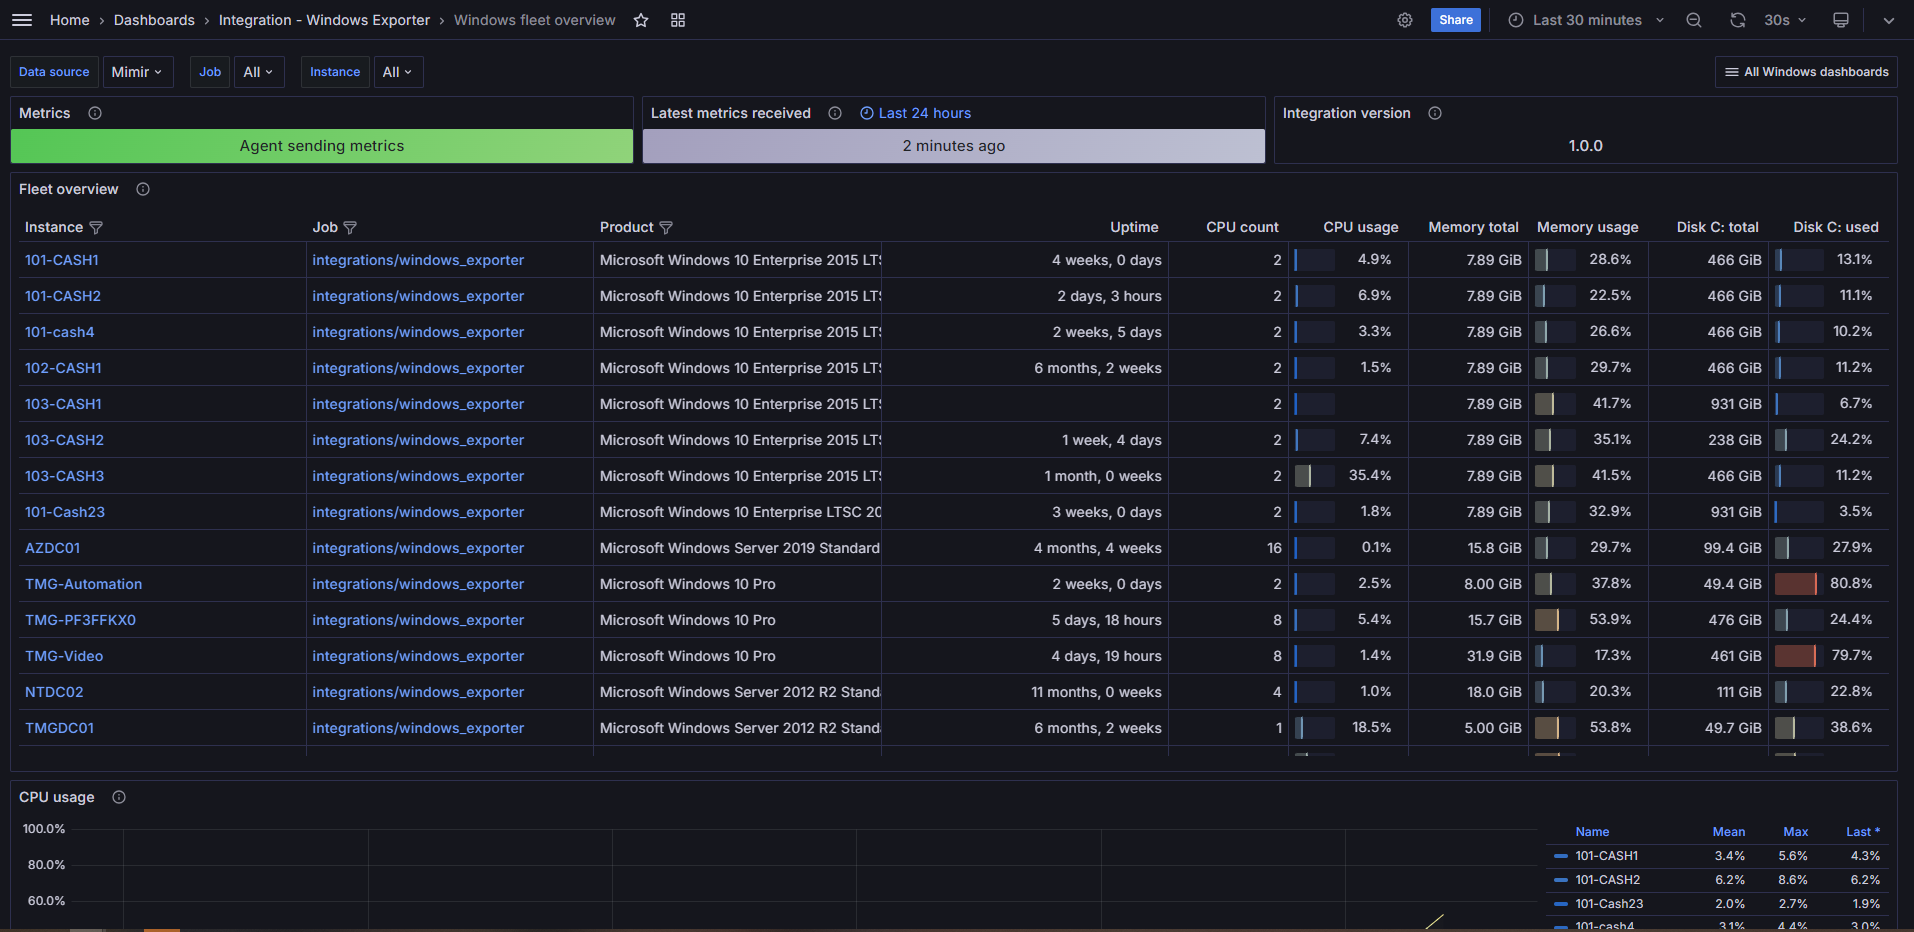
Windows Fleet Overview and Windows Dashboard Collection
To effectively utilize this dashboard collection, you must first install the Grafana Alloy agent. Follow the installation instructions available at Grafana Alloy Installation Guide. Additionally, configure your agent using the configuration provided at Windows Integration Config.
Make sure you download all the required dashboards for a comprehensive overview:
- Windows Fleet Overview: Dashboard Link
- Windows Overview: Dashboard Link
- Windows CPU and System: Dashboard Link
- Windows Disks and File Systems: Dashboard Link
- Windows Logs: Dashboard Link
Used Metrics 1919
-
up
windows_cs_hostname
windows_os_info
windows_system_system_up_time
windows_cs_logical_processors
windows_cpu_time_total
windows_cs_physical_memory_bytes
windows_os_physical_memory_free_bytes
windows_logical_disk_size_bytes
windows_logical_disk_free_bytes
ALERTS
group
topk
windows_logical_disk_idle_seconds_total
windows_net_packets_outbound_errors_total
windows_net_packets_received_errors_total
windows_net_packets_received_unknown_total
windows_net_packets_outbound_discarded_total
windows_net_packets_received_discarded_total