SpringBoot APM Dashboard(中文版本) 1,7521,752
6/13/2024
6/13/2024
1
>=10.0.1
Prometheus
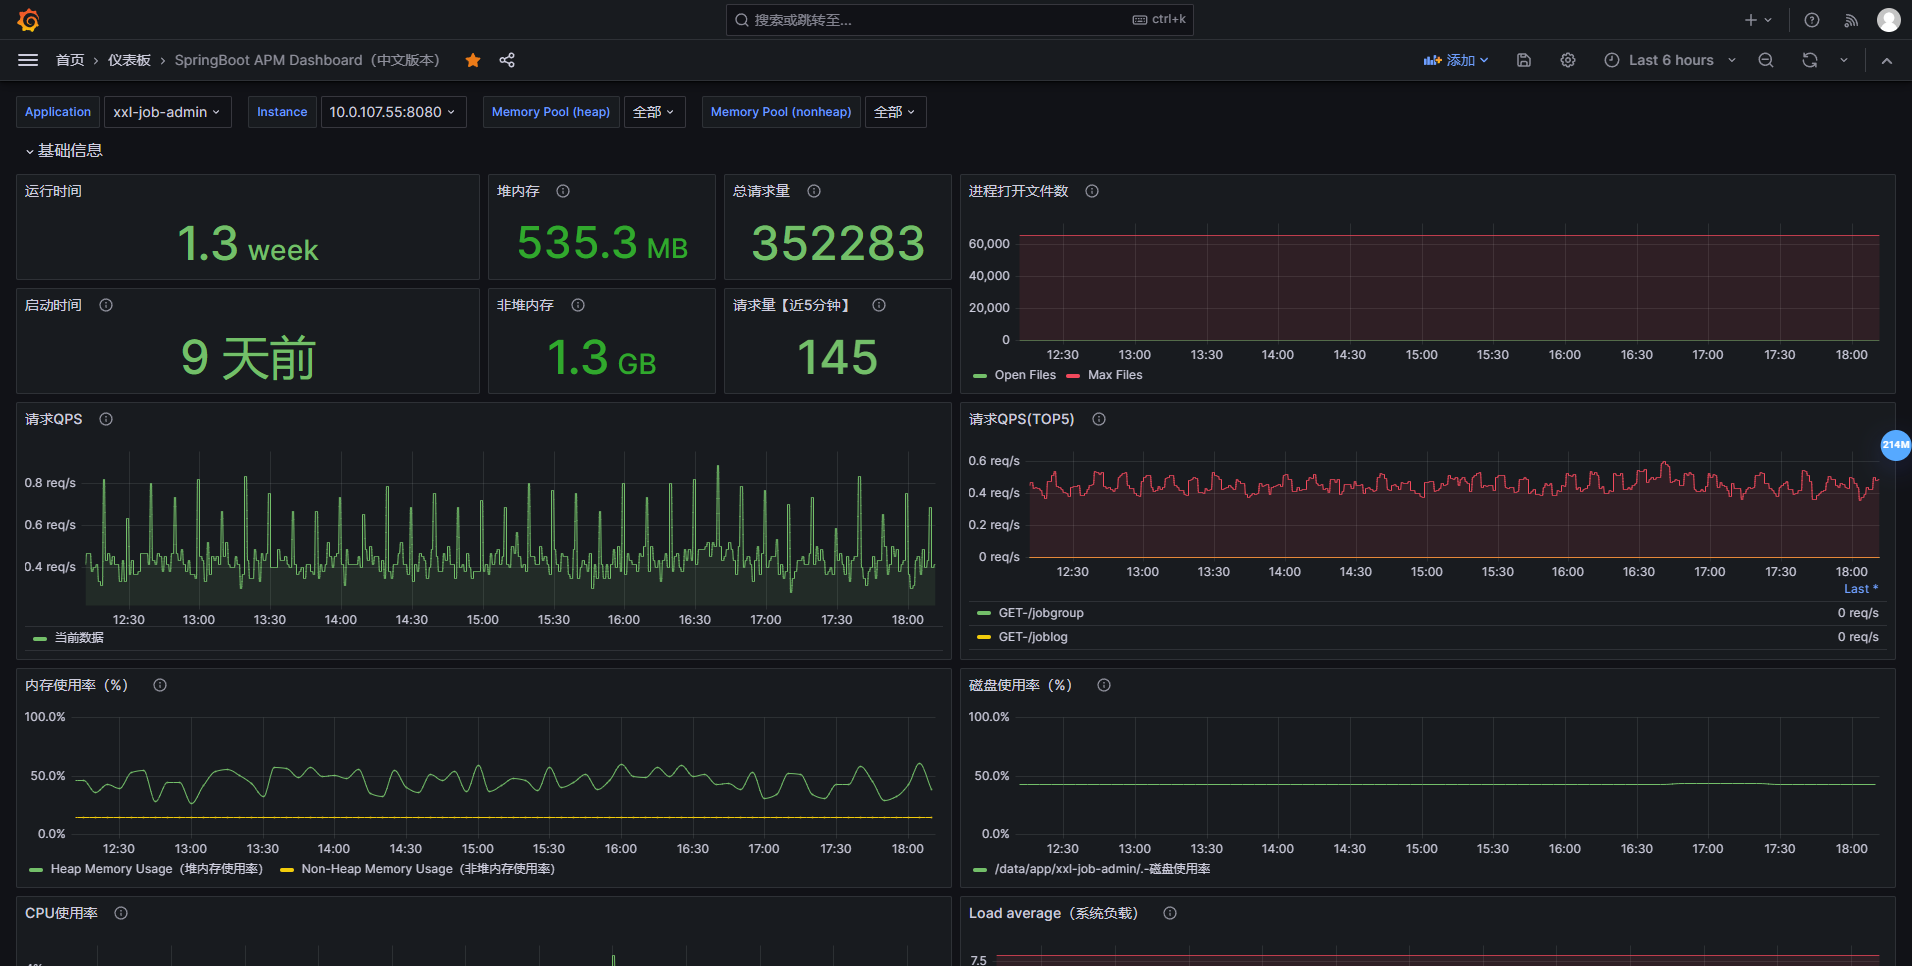
pringBoot APM Dashboard(中文版本)
Export Dashboard✕
Download
Copy to Clipboard
Used Metrics 2828
process_uptime_seconds
jvm_memory_max_bytes
http_server_requests_seconds_count
process_files_open_files
process_files_max_files
-
process_start_time_seconds
topk
jvm_memory_used_bytes
disk_total_bytes
disk_free_bytes
system_cpu_usage
process_cpu_usage
system_load_average_
system_cpu_count
jvm_memory_committed_bytes
jvm_classes_loaded_classes
jvm_classes_unloaded_classes_total
jvm_buffer_memory_used_bytes
jvm_buffer_total_capacity_bytes
jvm_threads_daemon_threads
jvm_threads_live_threads
jvm_threads_peak_threads
jvm_gc_memory_allocated_bytes_total
jvm_gc_memory_promoted_bytes_total
jvm_gc_pause_seconds_count
jvm_gc_pause_seconds_sum
http_server_requests_seconds_sum
logback_events_total