CrowdSec Metrics 1,1431,143
6/30/2024
3/18/2025
6
>=11.5.2
Prometheus
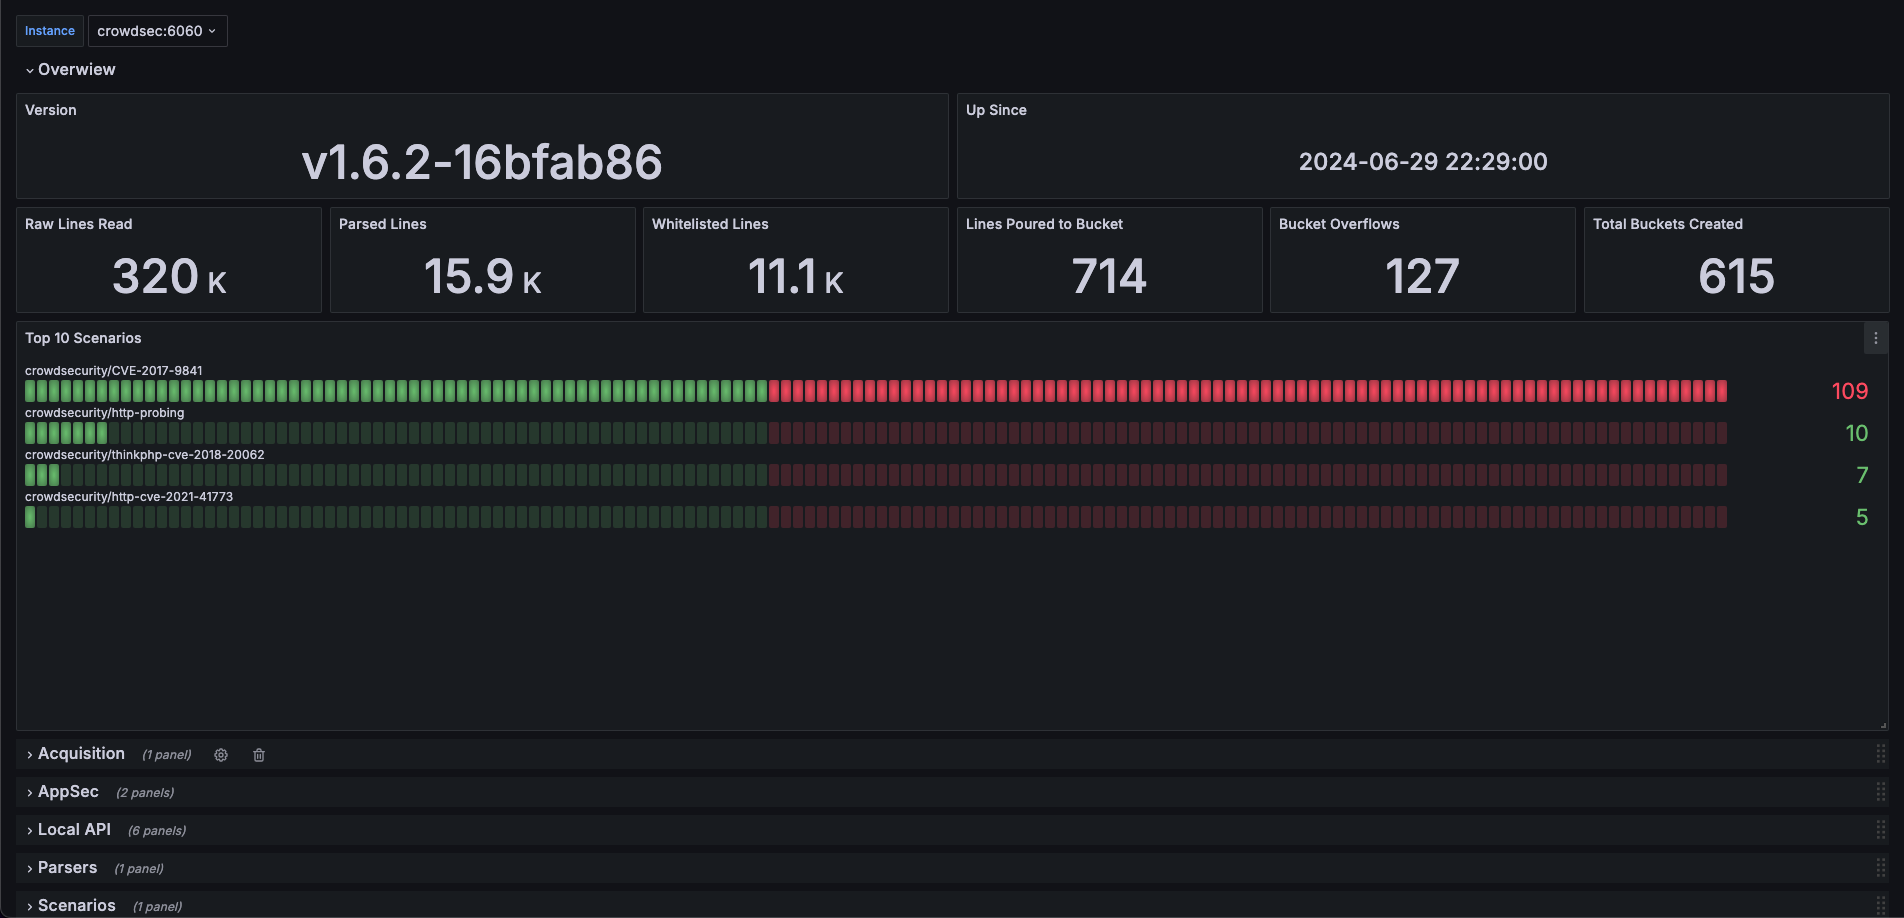
To use this dashboard follow the instructions on crowdsec's doc. Note that there may be small errors due to the fact that CrowdSec does not initialize all counters to zero at start (see this issue).
Export Dashboard✕
Download
Copy to Clipboard
Used Metrics 1313
cs_info
-
process_start_time_seconds
cs_filesource_hits_total
cs_cloudwatch_stream_hits_total
cs_journalctlsource_hits_total
cs_syslogsource_hits_total
cs_dockersource_hits_total
cs_parser_hits_ok_total
cs_node_wl_hits_ok_total
cs_bucket_poured_total
cs_bucket_overflowed_total
cs_bucket_created_total
topk