All in one 854854
Grafana - All in One 📊
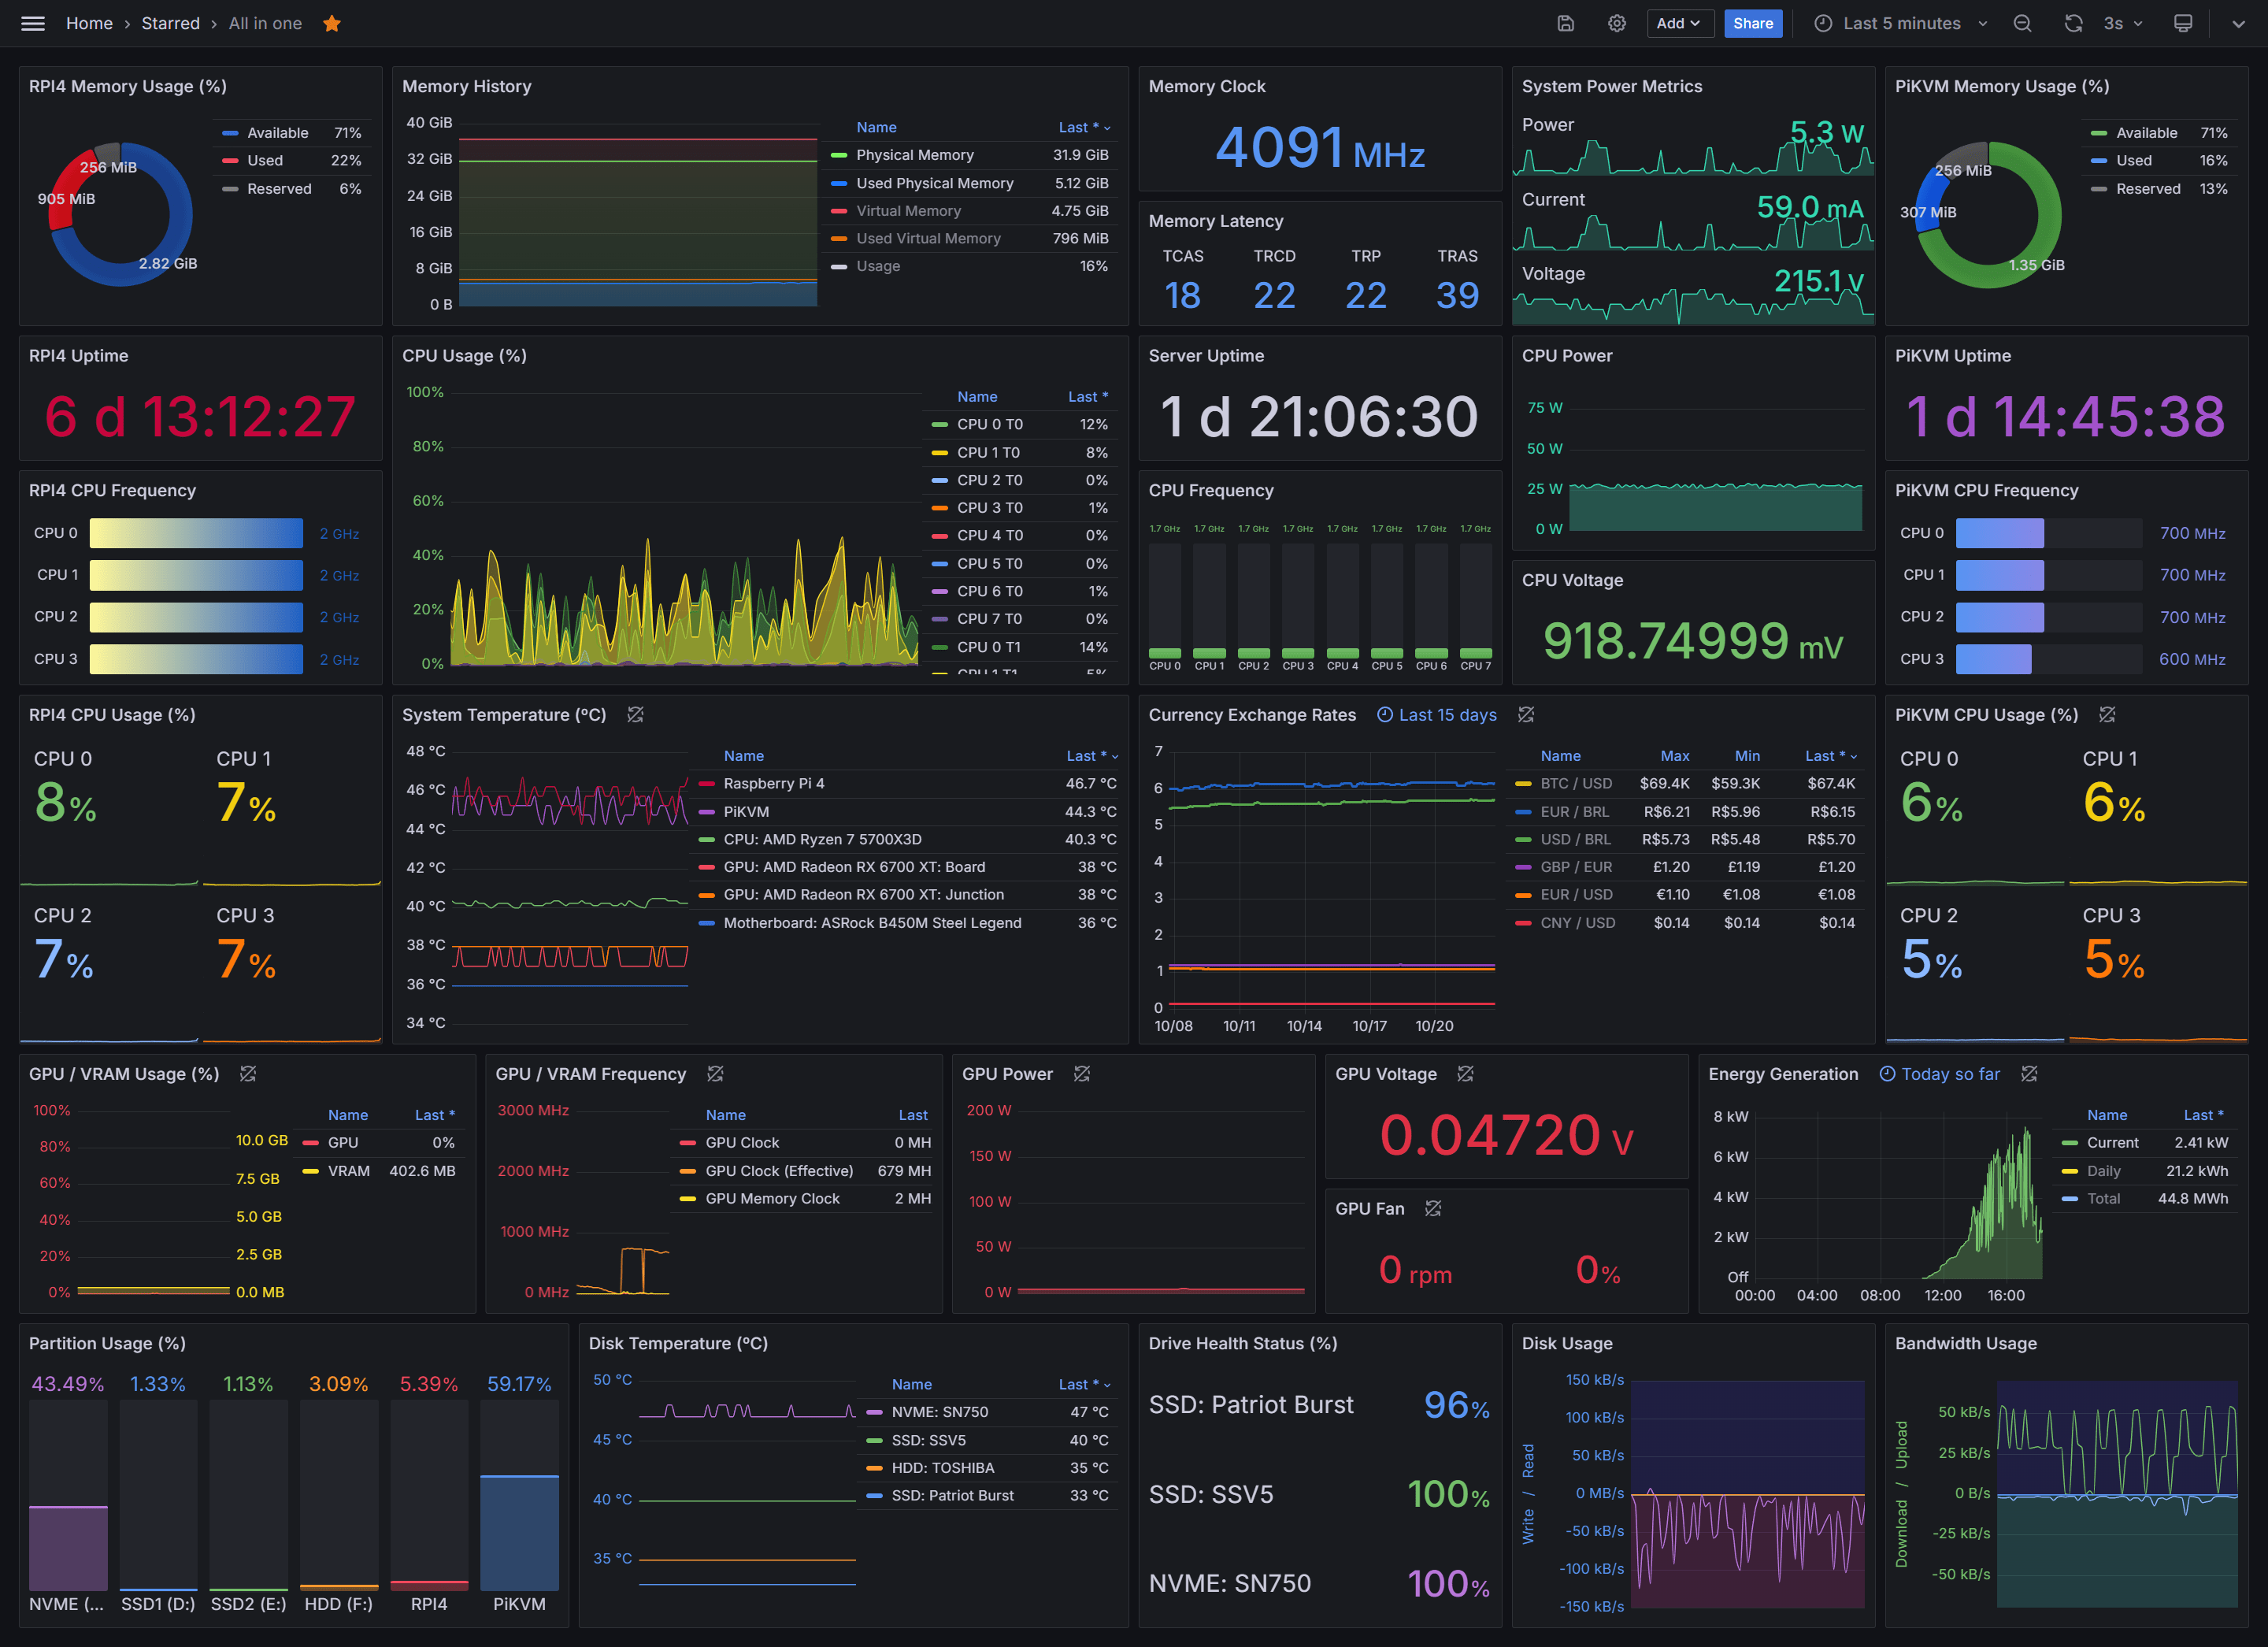
Welcome to Grafana All in One—your all-encompassing monitoring solution designed to integrate various data sources and exporters into a single Grafana dashboard. This project provides a broad view of multiple systems, from Raspberry Pi to solar inverters and smart plugs.
Grafana Version: 11.3.0
Overview 🚀
Grafana All in One aggregates metrics from different exporters into a single Grafana dashboard. The solution offers centralized monitoring, allowing you to keep a close watch on devices, track real-time exchange rates, and monitor solar power production efficiently.
Required Exporters 📦
Node Exporter: Gathers essential hardware and OS metrics, such as CPU, memory, disk, and network usage, from your PiKVM and Raspberry Pi 4 devices. It’s a key component for monitoring system-level performance on Linux-based systems.
Windows Exporter: Similar to Node Exporter, but designed for Windows-based systems. It captures system metrics such as CPU usage, memory, disk I/O, and more, helping you monitor the health and performance of your Windows machines.
PromDapter: Works in conjunction with HWiNFO to collect detailed hardware metrics from Windows systems. This setup allows you to monitor temperatures, voltages, fan speeds, and other key hardware parameters.
Solis Inverter Exporter: Monitors your Solis inverter to collect essential solar power metrics, including current energy generation, daily production, and total output over time.
Tuya Smart Plug Exporter: Collects and monitors power consumption, current, and voltage from your Tuya smart plugs, providing detailed insights into the energy usage and electrical characteristics of connected devices.
Currency Exporter: A specialized exporter that tracks real-time currency exchange rates. It’s ideal for monitoring financial metrics and keeping tabs on currency fluctuations.
Installation 🛠️
To set up this monitoring solution:
Set Up Exporters: Follow the instructions provided in each exporter's repository to set them up on your respective devices. Ensure they are properly configured to expose metrics for Prometheus.
Configure Prometheus: Ensure your Prometheus
prometheus.ymlfile includes scrape configs for all the exporters mentioned above.Import the Dashboard: Import the Grafana dashboard by following these steps:
- Go to your Grafana instance.
- Navigate to
Dashboards>New>Import. - Enter the dashboard ID
21674and clickLoad. - Assign your data sources to the appropriate panels and save the dashboard.
Start Monitoring: Access your Grafana dashboard and start monitoring your systems in real-time.
Dashboard 📈
Check out the Grafana dashboard here: All in one.
This dashboard is designed to provide a comprehensive view of all your systems, seamlessly integrating data from various exporters.
Used Metrics 5353
-
node_memory_MemTotal_bytes
-
node_memory_MemAvailable_bytes
hwi_memory_available_mb
hwi_memory_used_mb
hwi_virtual_memory_committed_mb
hwi_memory_load
hwi_memory_clock_mhz
tuya_consumption_power
tuya_consumption_current
tuya_consumption_voltage
hwi_memory_tcas_t
hwi_memory_trcd_t
hwi_memory_trp_t
hwi_memory_tras_t
-
node_cpu_seconds_total
hwi_core_usage
windows_system_system_up_time
hwi_cpu_package_power_w
-
node_cpu_scaling_frequency_hertz
hwi_core_clock_mhz
hwi_cpu_voltage_v
hwi_cpu_tctltdie_c
hwi_motherboard_c
hwi_gpu_temperature_c
hwi_gpu_hot_spot_temperature_c
node_thermal_zone_temp
BTC_USD
CNY_USD
EUR_BRL
EUR_USD
GBP_EUR
USD_BRL
hwi_gpu_d_usage
hwi_gpu_d_memory_dedicated_mb
hwi_gpu_clock_mhz
hwi_gpu_memory_clock_mhz
hwi_gpu_ppt_w
hwi_gpu_core_voltage_v
inverter_power
inverter_energy_today
inverter_energy_total
hwi_gpu_fan_rpm
hwi_gpu_fan
windows_logical_disk_free_bytes
windows_logical_disk_size_bytes
-
node_filesystem_size_bytes
-
node_filesystem_free_bytes
hwi_drive_temperature_c
hwi_drive_remaining_life
hwi_drive_read_rate_mbs
hwi_drive_write_rate_mbs
hwi_network_up_rate_kbs
hwi_network_dl_rate_kbs