Redis Cluster 1,0821,082
9/14/2024
9/14/2024
1
>=11.1.4
Prometheus
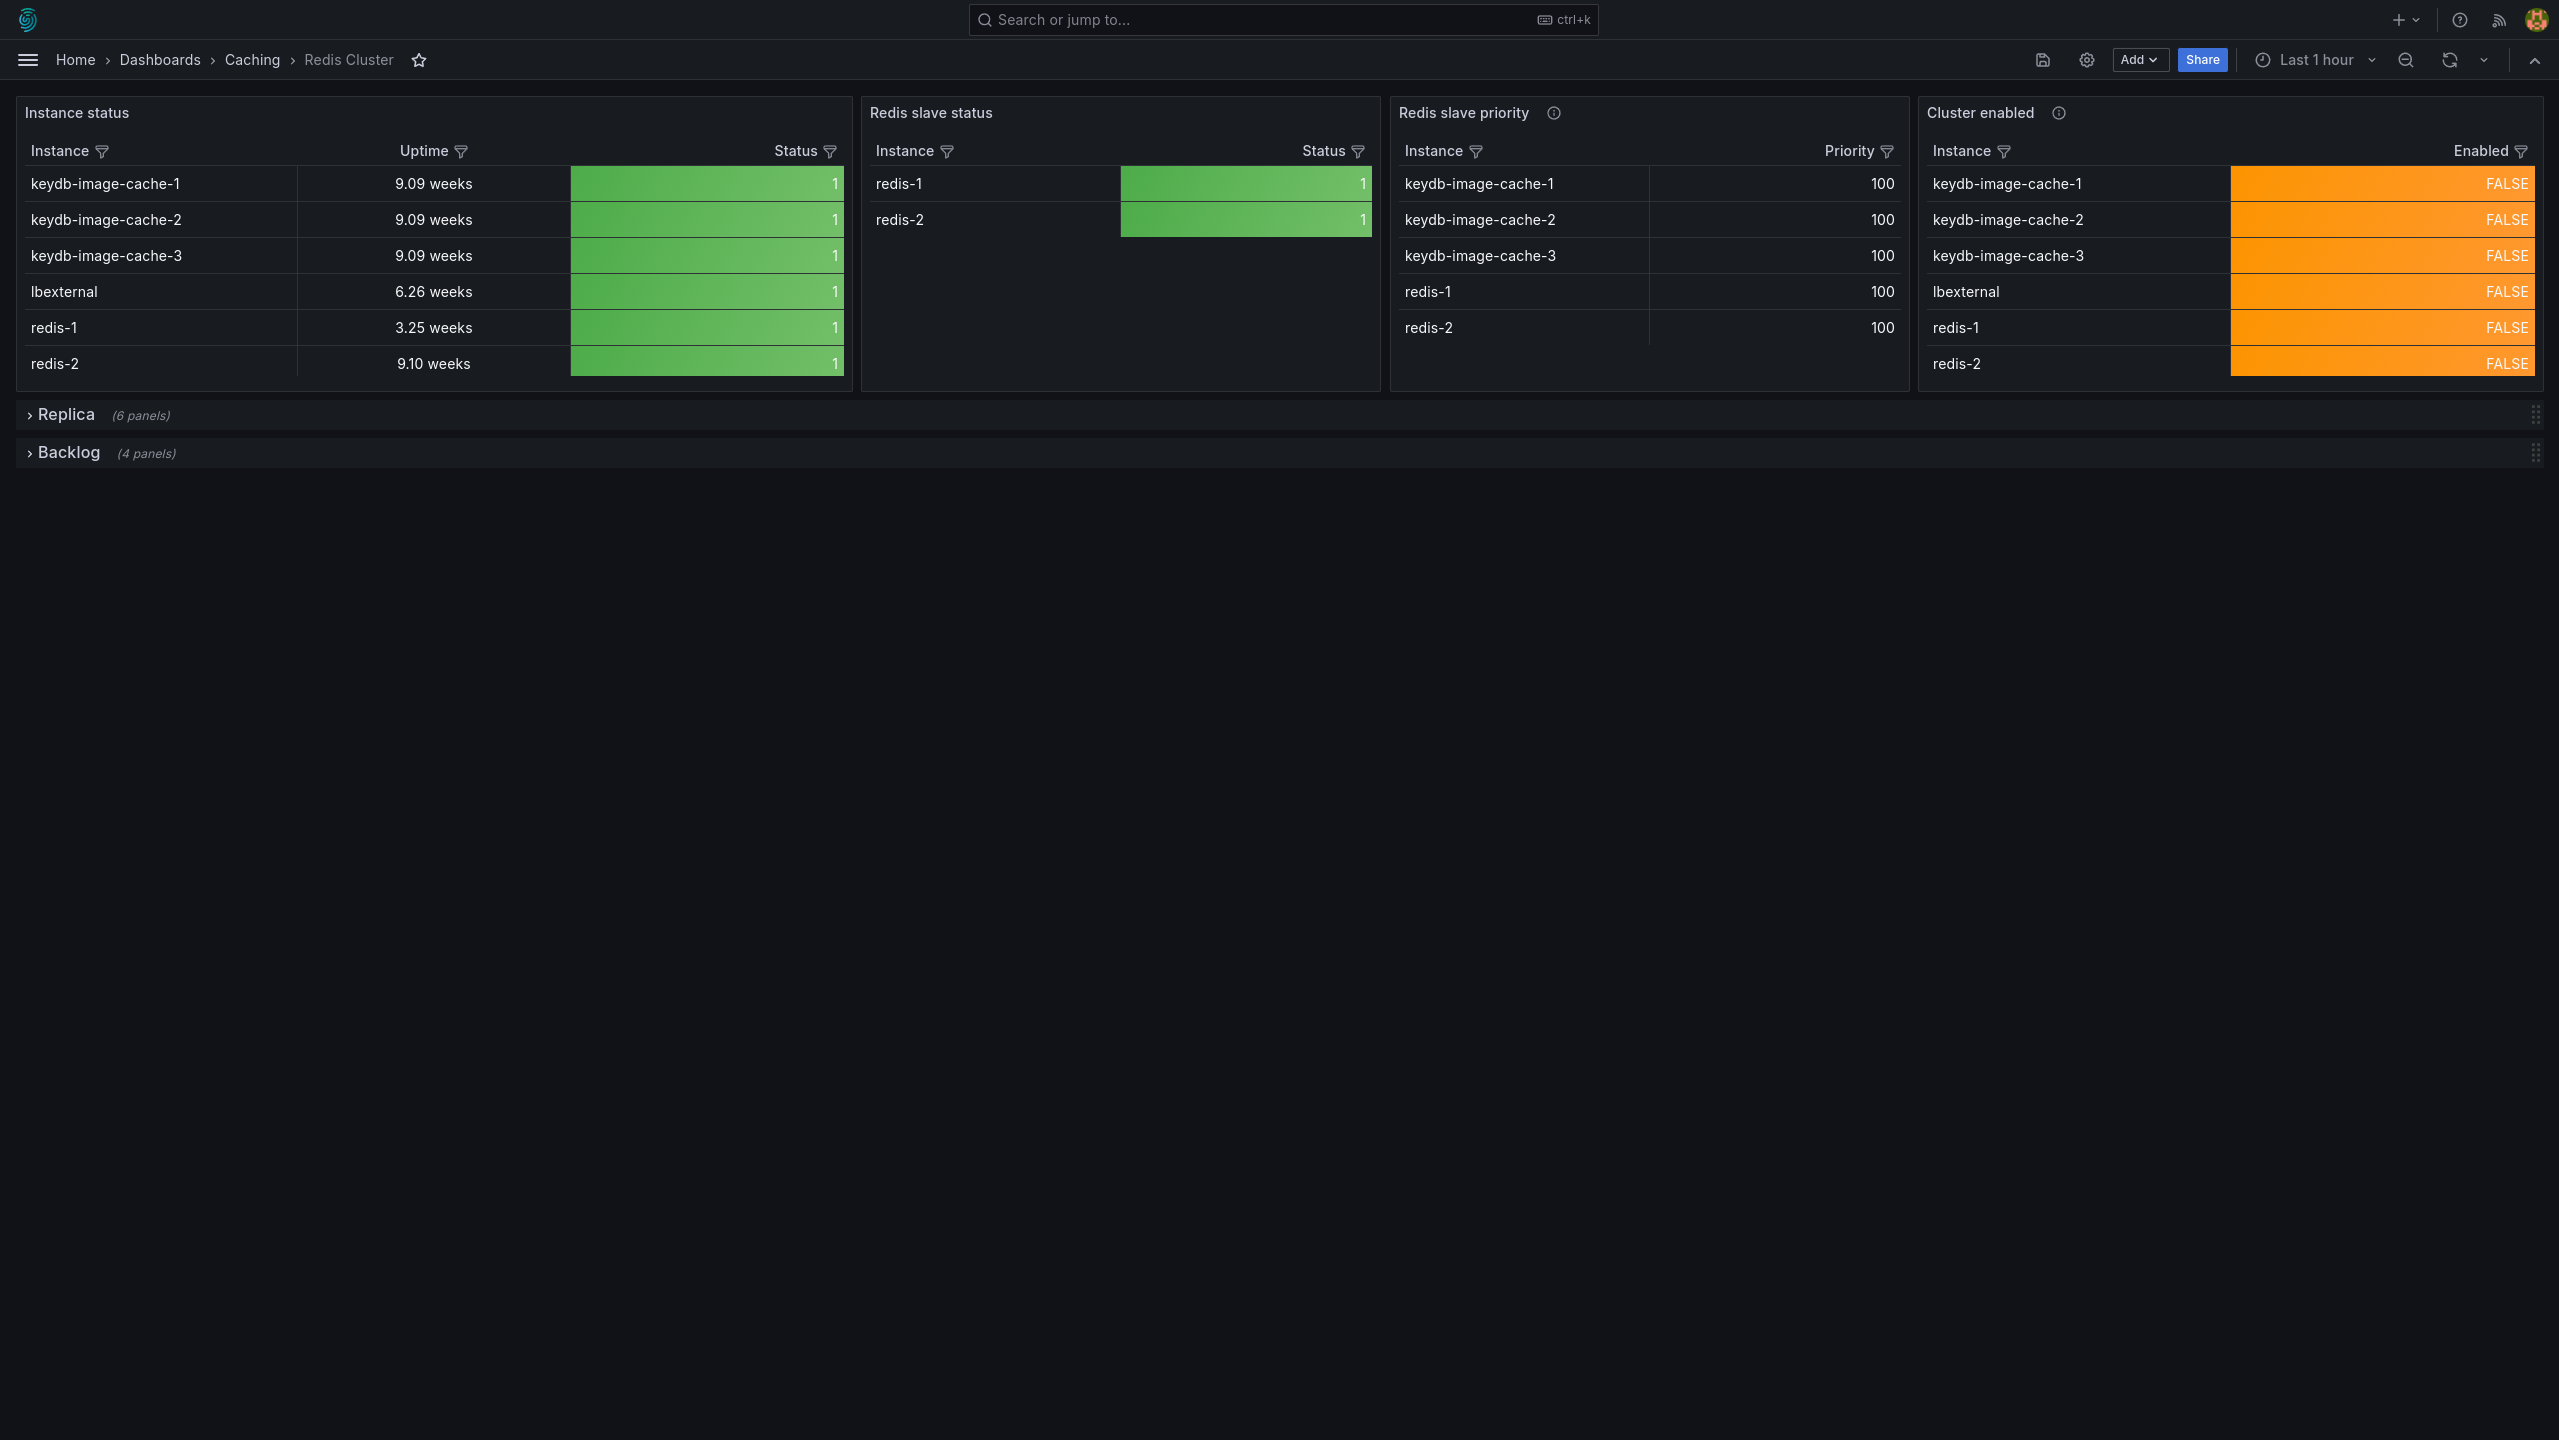
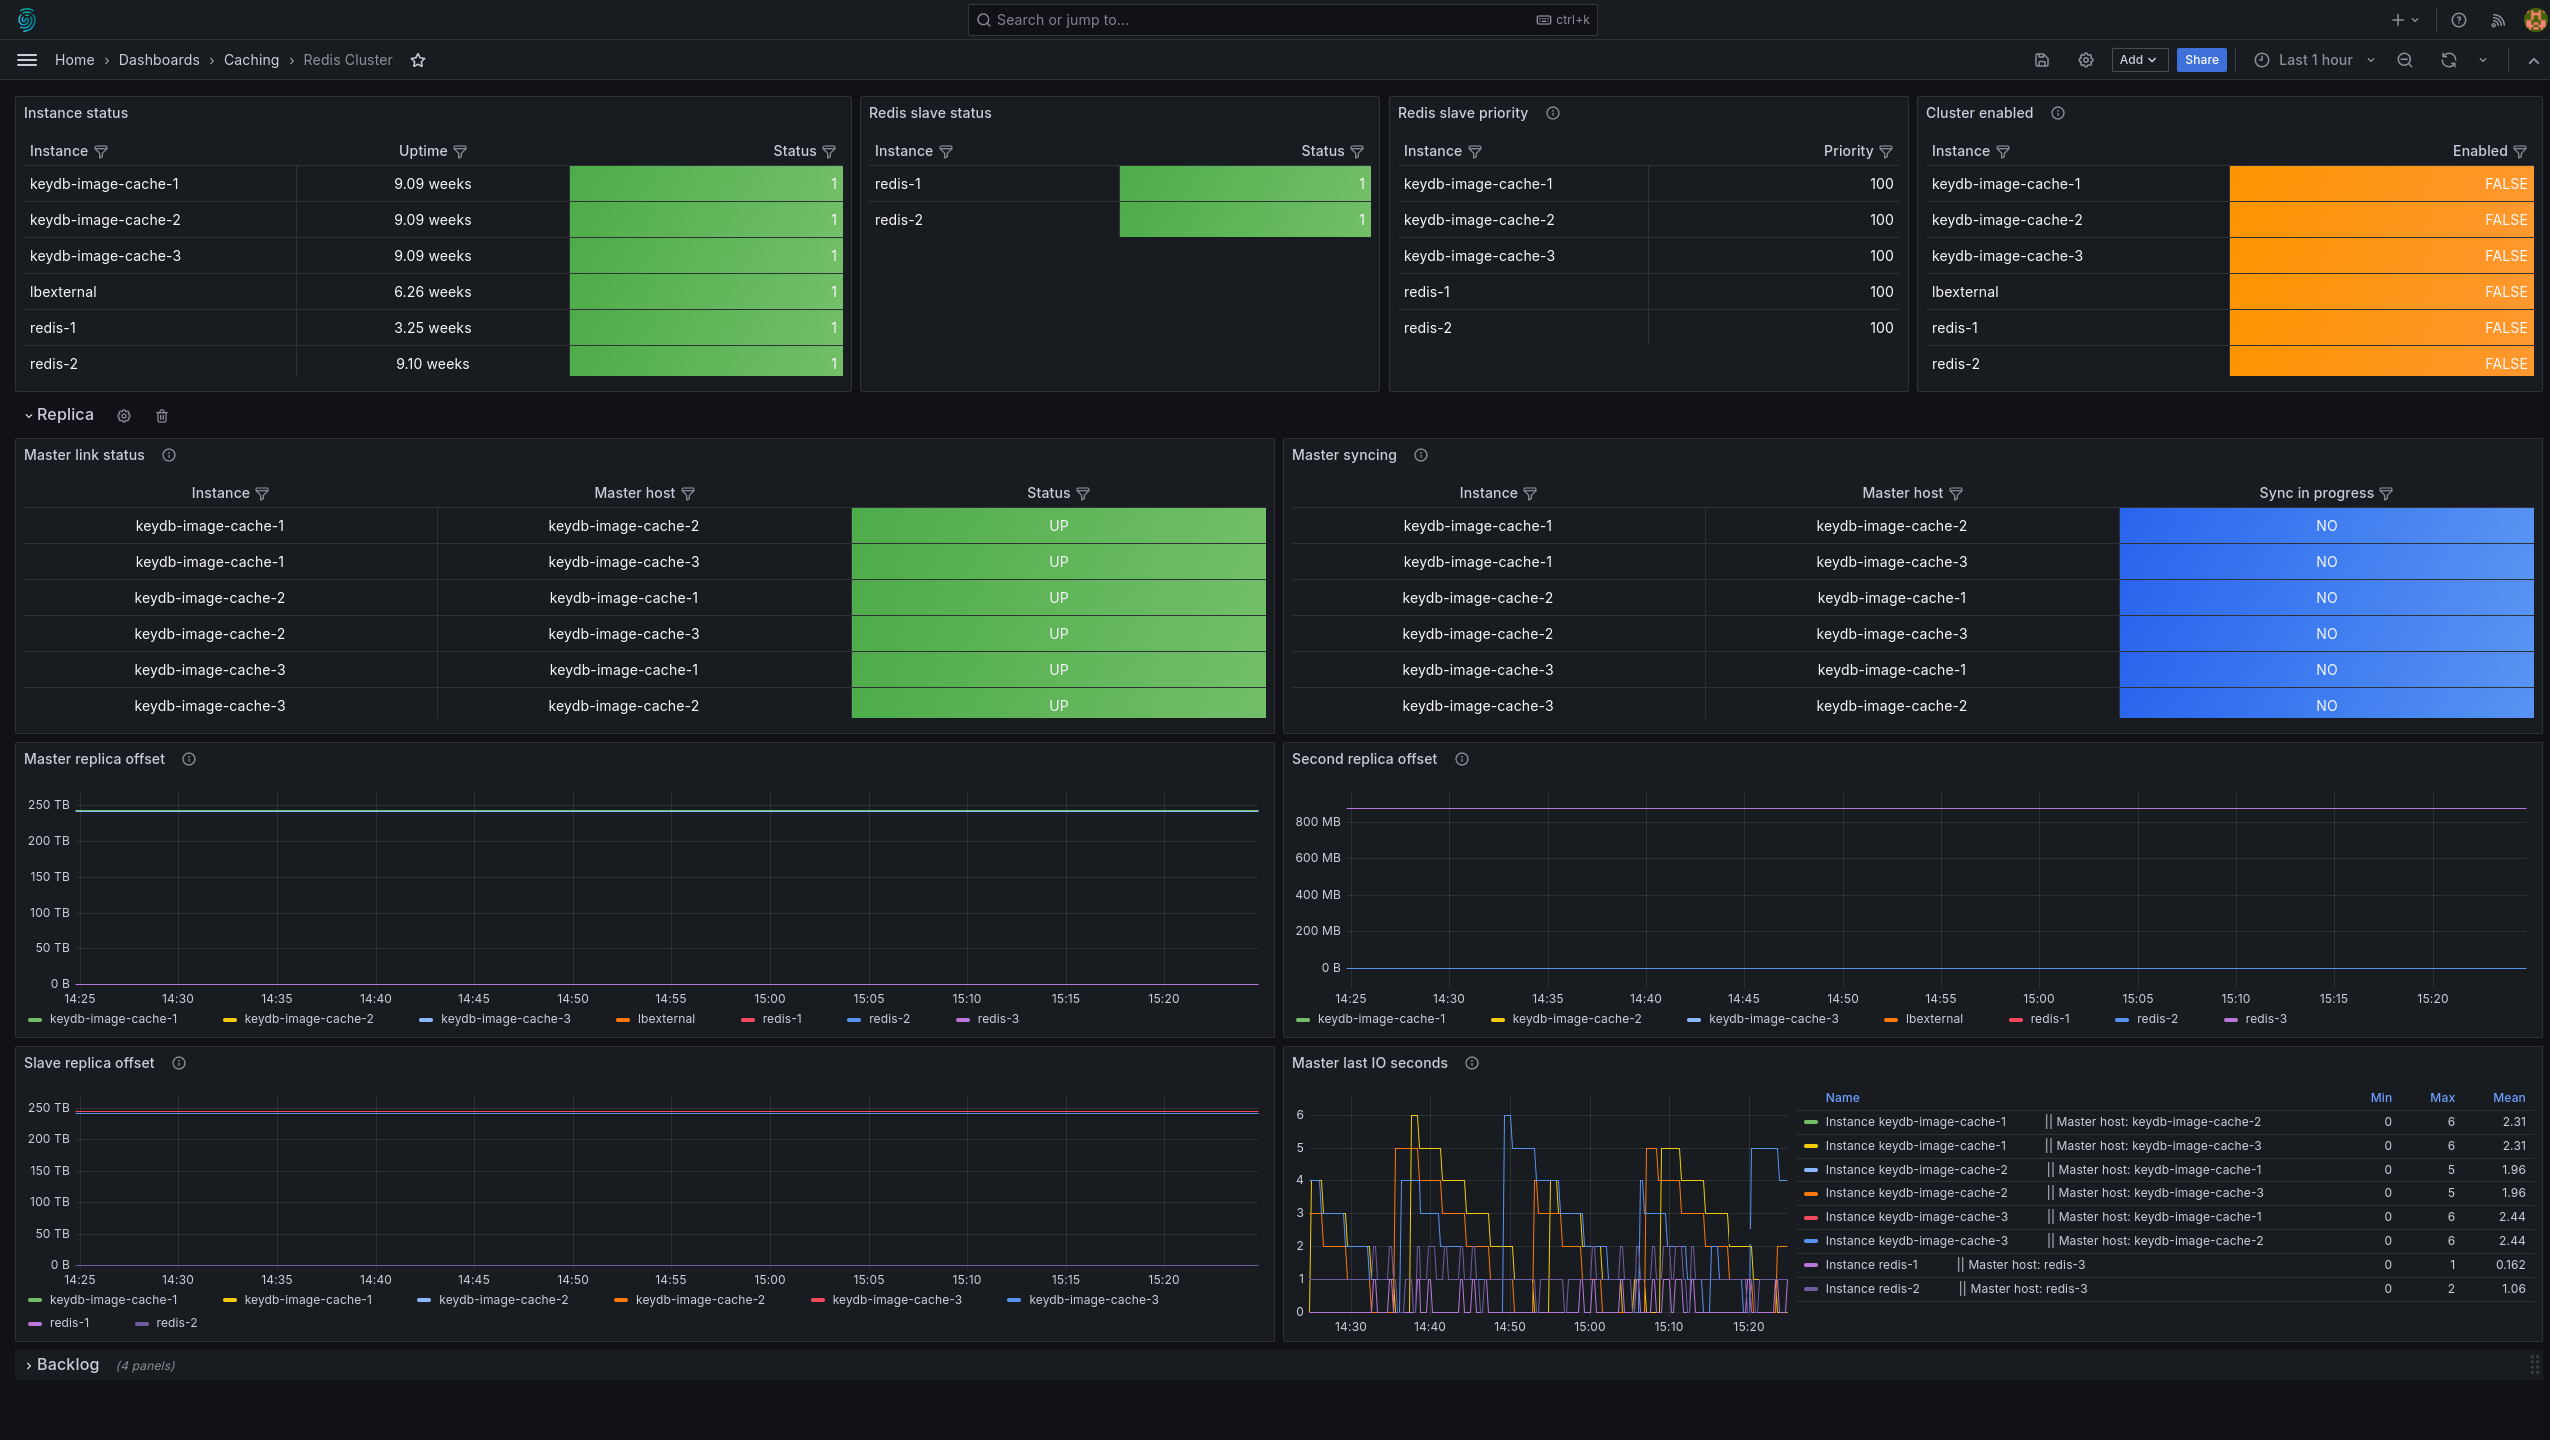
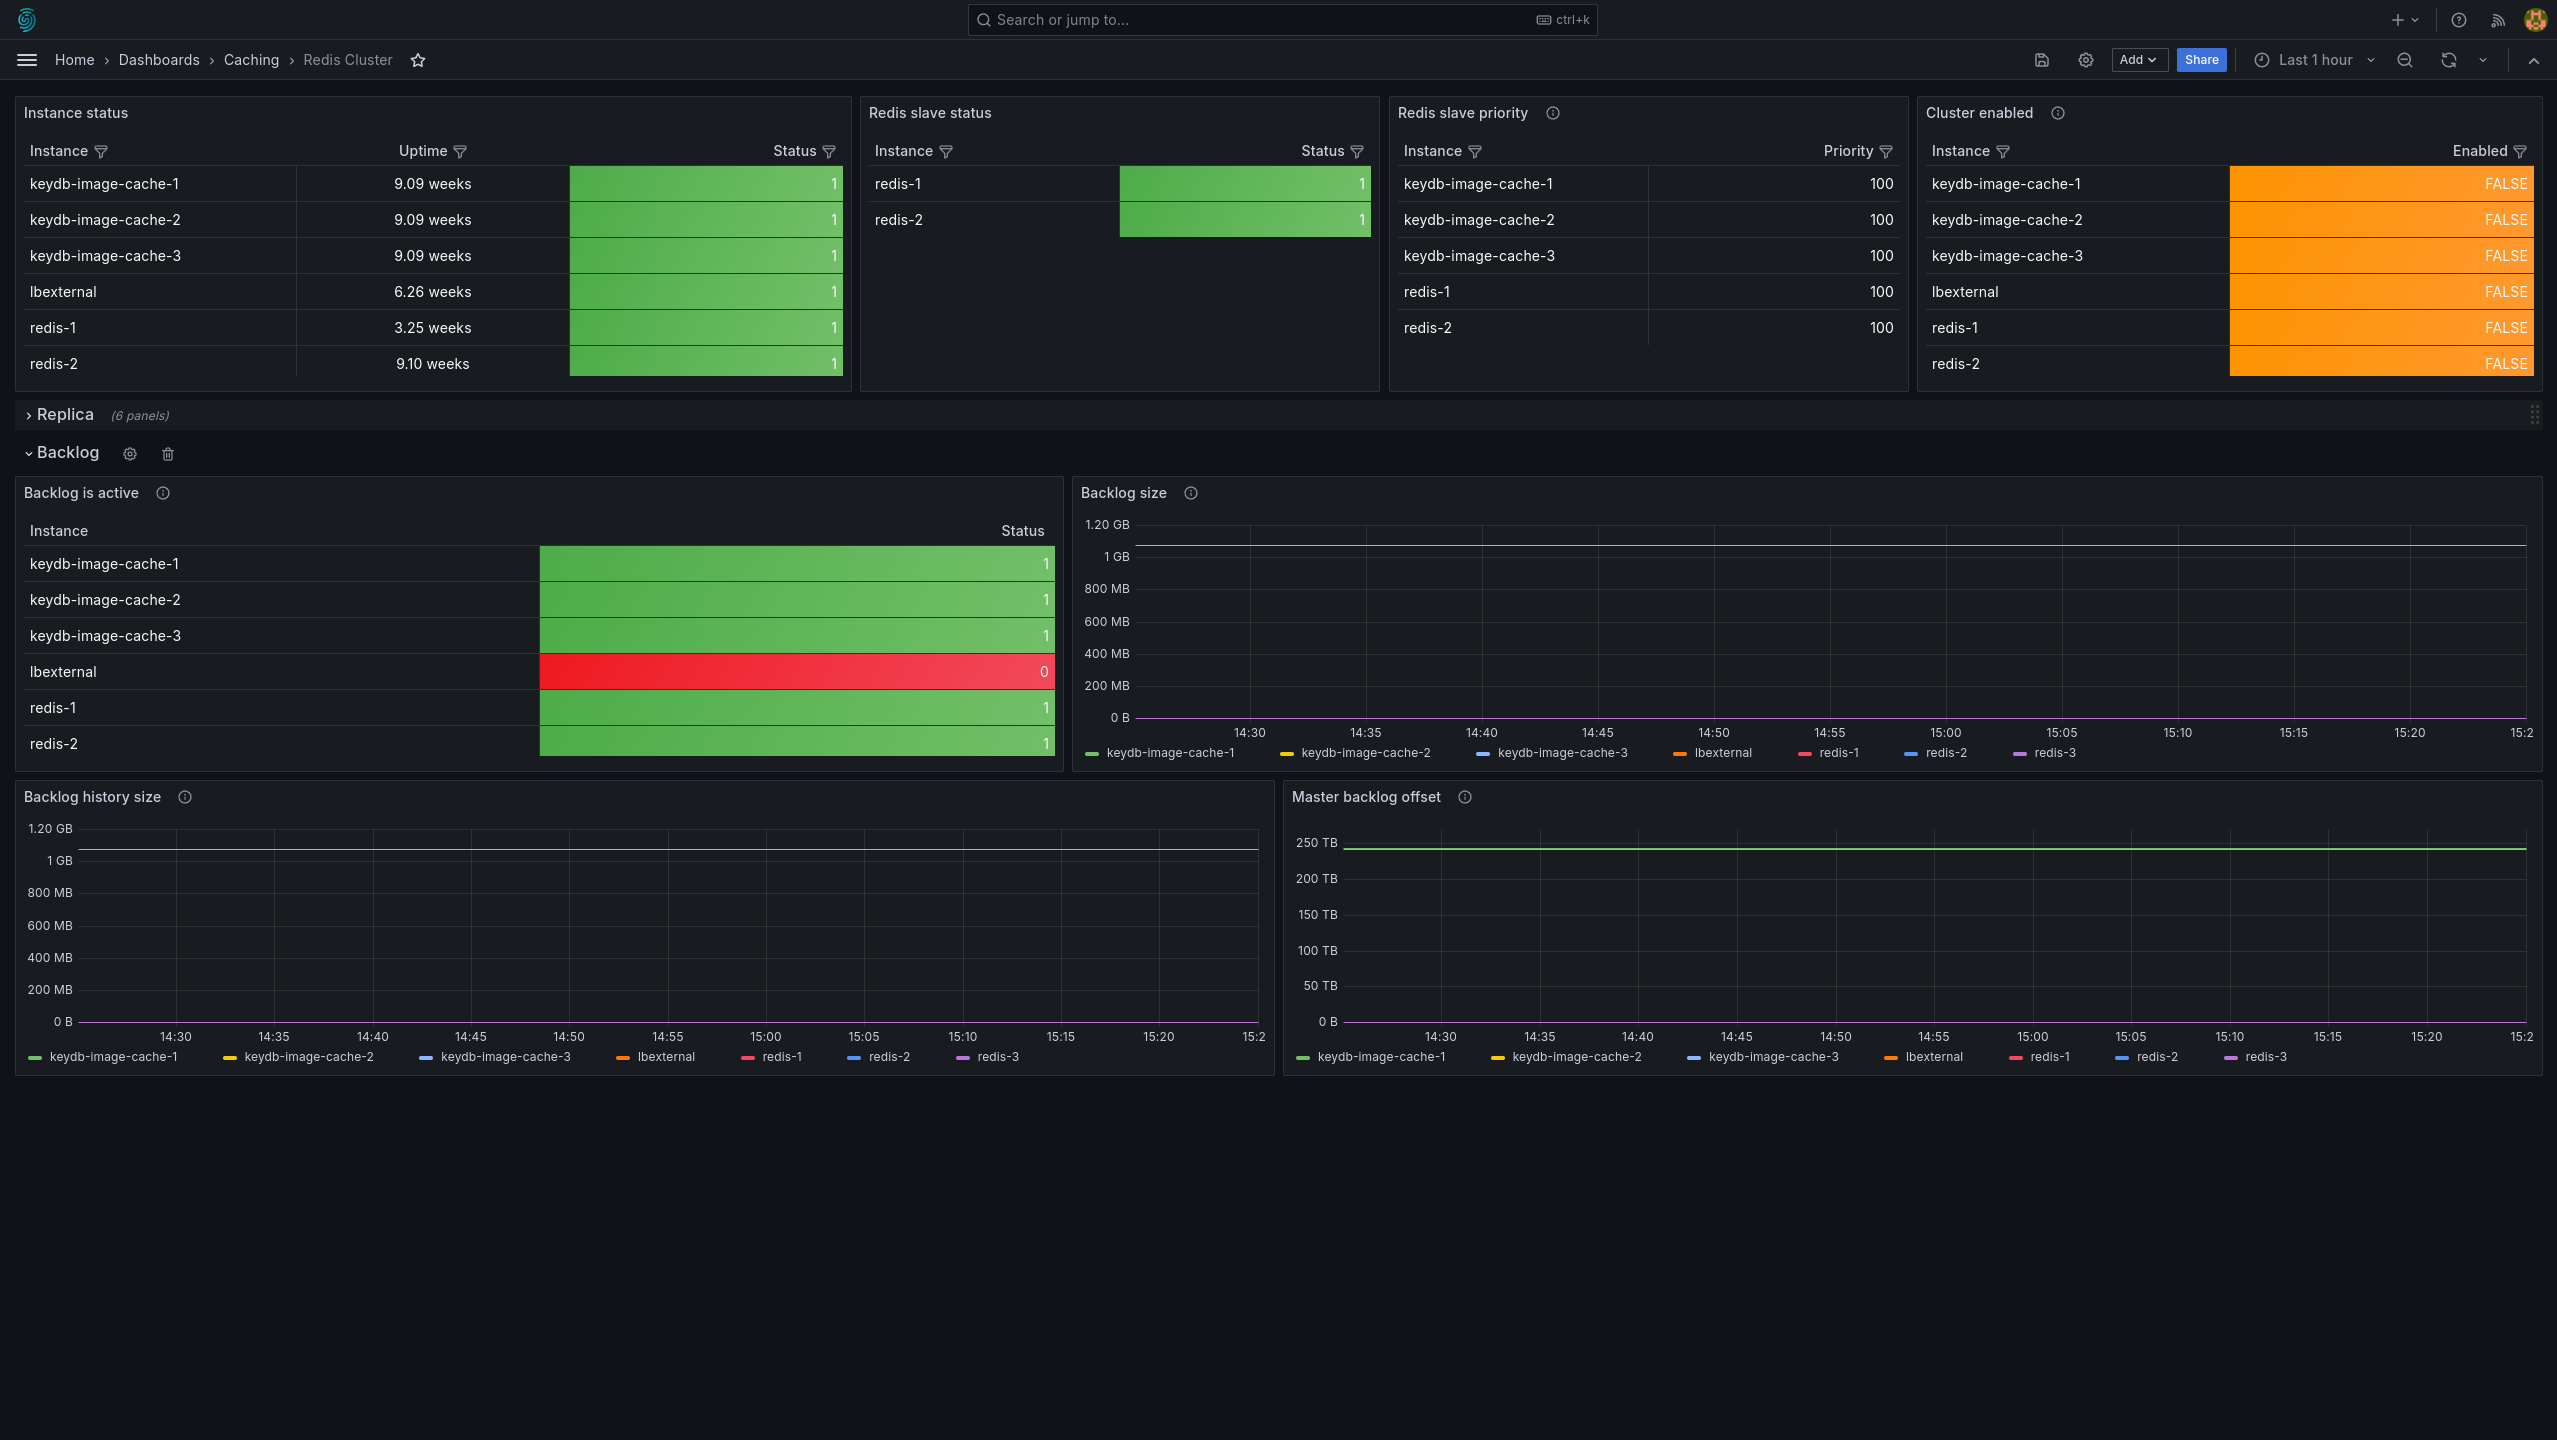
Redis cluster dashboard 📈
This dashboard was made for scratch. Dashboard is showing state and configuration for Redis cluster. Metrics used are exported by Redis exporter.
Github repo 📂
https://github.com/jura43/grafana-dashboards/tree/main/redis-cluster-dashboard
Feedback ⭐
If you liked this dashboard consider leaving review or starring Github repo.
Export Dashboard✕
Download
Copy to Clipboard
Used Metrics 55
-
redis_up
-
redis_uptime_in_seconds
redis_slave_info
redis_slave_priority
-
redis_cluster_enabled